Course Objectives
1. How much does the Data Analytics Course cost in Chennai and are there any hidden fees?
A: At Edubrights, our Data Analytics Course is transparently priced at ₹19,800 after applying a current 20% discount from the original price of ₹26,000. This fee is all-inclusive, covering live instructor-led training, comprehensive study materials, certification guidance, and dedicated placement support without any hidden charges. We believe in making quality education accessible, which is why we also offer flexible EMI options to ensure that financial constraints do not hinder your career growth.
2. Is the Edubrights Data Analytics course worth the investment compared to cheaper alternatives like others?
A: While some competitors may offer lower base fees, Edubrights focuses on delivering superior return on investment through quality and depth rather than just low cost. Our course distinguishes itself by including five real-time production-grade projects such as fraud detection systems and IoT data processing, which are rarely found in basic courses. Additionally, you learn directly from trainers with over ten years of experience at top MNCs like HCL, TCS, and Accenture, and receive personalized career branding support including LinkedIn optimization and GitHub portfolio building, which significantly enhances your hiring potential beyond what a simple certificate can offer.
3. Does the Edubrights curriculum cover Machine Learning or is it limited to basic analytics?
A: Our curriculum is designed to take you beyond basic reporting and into advanced analytical capabilities. Module 9 of our course is specifically dedicated to Introduction to Machine Learning for Analysts, where you will gain hands-on experience with Linear and Logistic Regression, Clustering for customer segmentation, and Time Series Analysis using Python. This comprehensive approach ensures that you are not only prepared for entry-level analyst roles but are also equipped with the predictive modeling skills required for more advanced positions in the industry.
4. What makes Edubrights’ projects different from other institutes in Chennai?
A: Unlike many institutes that provide static datasets for simple cleaning exercises, Edubrights challenges you to build production-grade data pipelines that mimic real-world industry scenarios. You will work on complex projects such as designing a real-time fraud detection streaming system for banking transactions, implementing a Medallion Architecture for retail data lakehouses, and processing continuous IoT sensor data for predictive maintenance. These advanced projects demonstrate your ability to handle large-scale, dynamic data environments, making your resume stand out significantly to top-tier recruiters who value practical, scalable solutions.
5. Do I need to know coding before joining the Data Analytics course?
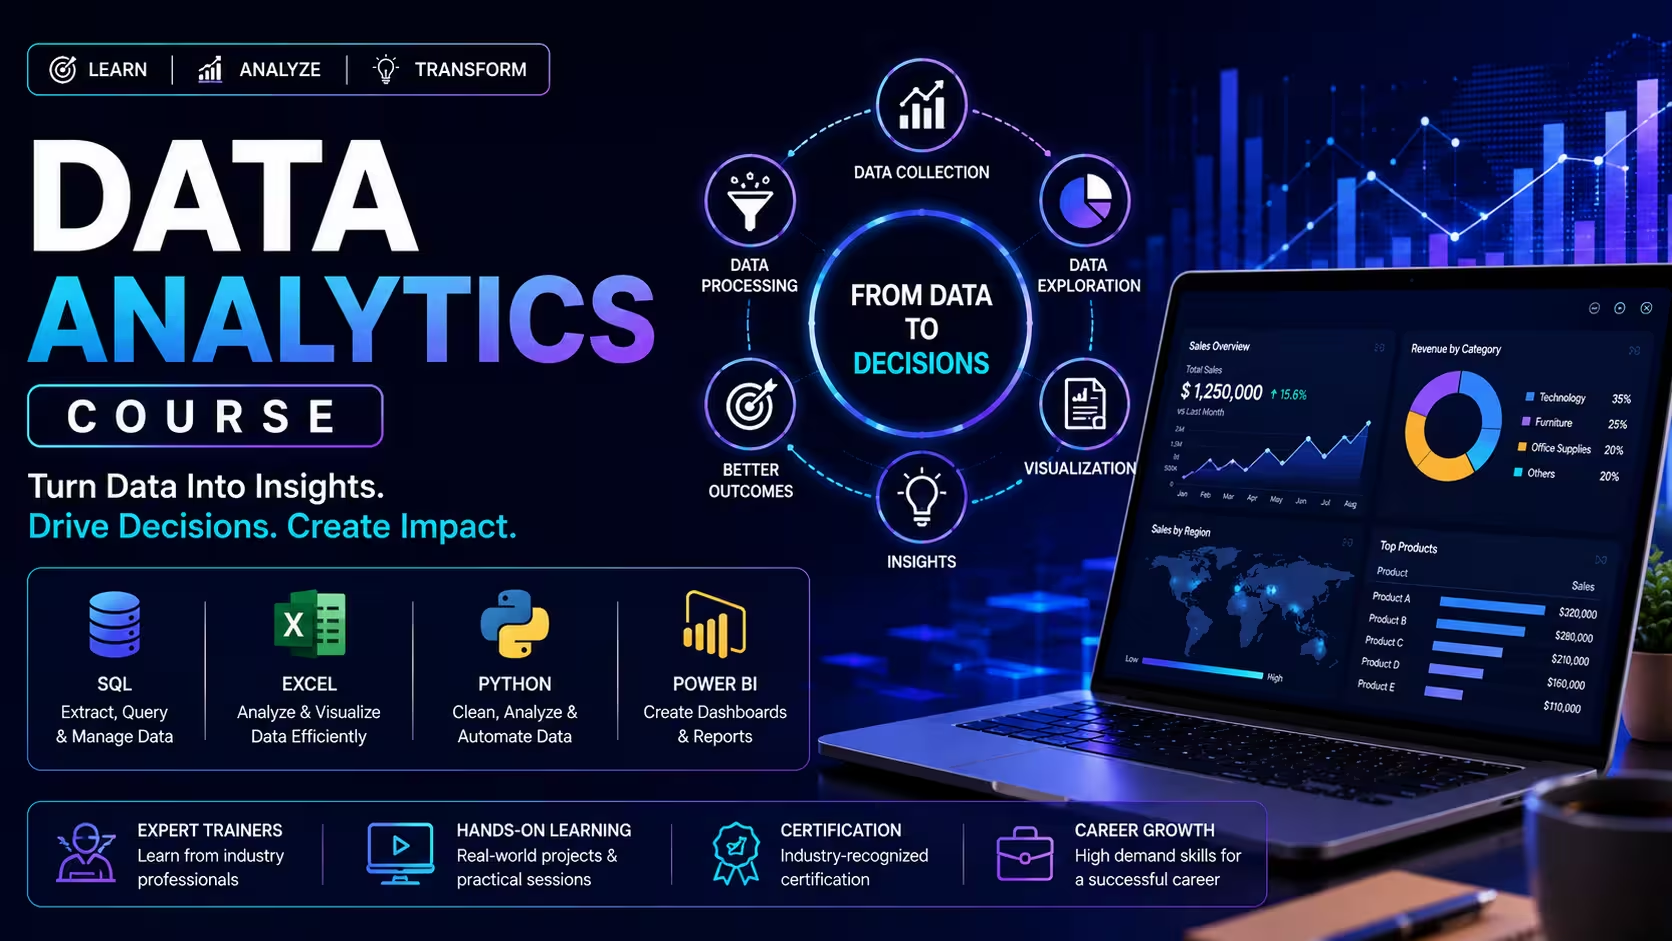
A: No prior coding experience is required to join our course as we structure the learning path to accommodate beginners effectively. We start with foundational concepts and gradually introduce you to essential tools, ensuring that by the end of the program you will be proficient in SQL for data querying and Python for advanced analysis and automation. Our step-by-step module structure transitions smoothly from Excel to SQL and then to Python and Power BI, allowing you to build confidence and competence without feeling overwhelmed by technical jargon.
6. What is Medallion Architecture and why is it included in your course objectives?
A: Medallion Architecture is a modern data design pattern widely used in big data environments like Databricks to organize data efficiently for better management and performance. It structures data into three distinct layers, starting with Bronze for raw data ingestion, moving to Silver for cleaned and validated data, and finally reaching Gold for business-ready aggregated data used in reporting. By including this concept in our curriculum, Edubrights prepares you for modern data engineering and analytics roles, giving you a competitive edge in understanding how enterprise-level data systems are structured and maintained.
7. What kind of placement support does Edubrights provide after course completion?
A: We provide comprehensive 100% job-oriented training support that goes beyond simple job referrals. Our placement assistance includes personalized resume building tailored to highlight your five real-time projects, LinkedIn profile optimization to attract active recruiters, and rigorous mock interviews covering both technical SQL and Python challenges as well as HR rounds. Furthermore, our trainers leverage their professional networks from companies like Cognizant, Capgemini, and Infosys to provide direct job referrals, ensuring you have multiple avenues to secure a position in the industry.
8. How is Edubrights’ placement assistance different from other major institutes?
A: While many institutes offer general placement support, Edubrights focuses heavily on personalized career branding and proof of skills. We help you build a tangible GitHub portfolio that showcases your actual code and project work, which is increasingly critical for recruiters who want to see practical application rather than just theoretical knowledge. This hands-on approach to career preparation gives you a distinct advantage over candidates who only possess a certificate, as it provides verifiable evidence of your ability to solve real-world data problems.
9. Is the training live or pre-recorded?
A: Our training is 100% live instructor-led to ensure maximum engagement and effective learning. This format allows you to ask questions in real-time, receive immediate feedback on your code and queries, and interact with peers for collaborative learning. Unlike pre-recorded videos which can lack interactivity and personalization, our live sessions ensure that you fully grasp complex topics like SQL joins or Python debugging through direct interaction with industry-expert trainers.
10. Who are the trainers at Edubrights?
A: Our trainers are practicing industry experts with over ten years of hands-on experience in leading multinational corporations such as HCL, TCS, Accenture, Cognizant, and Infosys. They bring real-world case studies from diverse sectors including banking, healthcare, and retail directly into the classroom, ensuring that you learn current industry practices and tools rather than outdated theoretical concepts. This direct exposure to professional insights helps bridge the gap between academic learning and actual workplace requirements.
Popular Techniques Covered in This Course
SQL (Structured Query Language)
Programming Languages: Python and R
Data Visualization Tools
Data Cleaning and Preparation
Advanced Excel Skills
Advanced SQL and Database Management
Data Transformation Engineering (dbt)
Predictive Asset Modeling
Data Storytelling & Reporting
Cloud Data Warehousing Foundations
Get Hands-on Knowledge about Real-Time Projects
Project 1
Project 1: Real-Time E-Commerce Data Pipeline
Build a production-grade pipeline to process live shopping data, customer clicks, and transactions for analytics dashboards.
Project 2
Project 2: Fraud Detection Streaming System
Design a real-time pipeline to detect fraudulent banking transactions using streaming data and anomaly detection logic.
Project 3
Project 3: End-to-End Retail Data Lakehouse
Implement Bronze-Silver-Gold architecture for retail sales, inventory, and customer analytics.
Project 4
Project 4: IoT Sensor Data Processing Pipeline
Process continuous IoT sensor data streams for predictive maintenance and system monitoring.
Project 5
Project 5: Healthcare Real-Time Analytics Platform
Build a secure pipeline to process patient data streams for real-time health insights and reporting.
Key Features
Edubrights offers Data Analyst Training in virtual mode with expert trainers. Here are the key features,
40 Hours Course Duration
100% Job Oriented Training
Industry Expert Faculties
Free Demo Class Available
Completed 500+ Batches
Certification Guidance
Curriculum
Module 1: Introduction to Data Analytics
- What is Data Analytics: Concepts, Types & Scope
- Structured vs. Unstructured Data
- Data Collection Methods and Sources
- Career Roles: Analyst, BI Analyst, Data Engineer
- Data-Driven Decision Making in Business
Module 2: Statistics & Probability for Analysts
- Descriptive Statistics: Mean, Median, Mode, Standard Deviation
- Probability Basics and Distributions
- Hypothesis Testing and Confidence Intervals
- Correlation and Regression Fundamentals
- A/B Testing for Business Decisions
Module 3: Excel for Data Analysis
- Core Formulas, Functions, Filtering & Sorting
- Pivot Tables and Pivot Charts
- Data Cleaning and Preprocessing in Excel
- Power Query for Data Transformation
- Building Dynamic Dashboards and Reports
Module 4: SQL & Database Management
- Relational Databases: Tables, Keys, Schemas
- Core Queries: SELECT, INSERT, UPDATE, DELETE
- Joins, Subqueries and CTEs
- Aggregations, Window Functions & GROUP BY
- Query Optimization and Indexing Basics
Module 5: Python for Data Analysis
- Python Basics: Variables, Loops, Functions
- NumPy and Pandas for Data Manipulation
- Data Cleaning, Wrangling and Preprocessing
- Exploratory Data Analysis (EDA)
- Matplotlib and Seaborn for Visualization
Module 6: Power BI & Data Visualization
- Power BI Interface: Reports, Data & Model Views
- Connecting and Transforming Data (Power Query)
- DAX Fundamentals: Measures and Calculated Columns
- Building Interactive Dashboards and Visuals
- Publishing, Sharing and Collaboration in Power BI
Module 7: Advanced SQL & Python
- Advanced SQL: Stored Procedures, Views, Triggers
- Connecting Python to SQL Databases
- Automating Data Workflows with Python
- Statistical Analysis with SciPy and Statsmodels
- Building End-to-End Analysis Pipelines
Module 8: Data Storytelling & Reporting
- Principles of Effective Data Visualization
- Choosing the Right Chart for the Right Data
- Structuring Business Reports and Presentations
- Dashboards for Stakeholders and Executives
- Communicating Insights Clearly and Concisely
Module 9: Intro to Machine Learning for Analysts
- What Analysts Need to Know About ML
- Linear and Logistic Regression with Python
- Clustering for Customer Segmentation
- Basic Time Series Analysis and Forecasting
- Model Evaluation and Interpreting Results
Module 10: Capstone Projects & Portfolio
- End-to-End Real-World Business Projects
- Sales, Marketing and Operations Case Studies
- Building a GitHub / Portfolio of Work
- Interview Prep: SQL Challenges and Case Studies
- Resume, LinkedIn and Job Application Guidance
Receive Training From Our Skilled and Effective Trainers
Experience in the Industry
Gain knowledge from experienced Data Analytics professionals who have worked on real-world projects across banking, healthcare, retail, e-commerce, manufacturing, telecommunications, finance, and technology sectors. Learn practical data analysis techniques, reporting methodologies, and business intelligence practices used by leading organizations.
Backgrounds at the Top
Our Data Analytics trainers have industry experience with leading organizations such as HCL, TCS, Accenture, Cognizant, Infosys, Capgemini, and other global technology and consulting companies, delivering analytics, business intelligence, and data-driven decision-making solutions.
Clear & Effective Teaching
Complex concepts such as Microsoft Excel, SQL, Python, Power BI, data cleaning, data visualization, dashboard development, business intelligence, data modeling, reporting, and statistical analysis are explained through real business scenarios, live demonstrations, and practical examples, making them easy to understand and apply.
Hands-On Learning Focus
Students gain practical experience by working on real-world datasets, business case studies, interactive dashboards, KPI reporting, SQL queries, Python-based data analysis, Excel automation, and Power BI projects through structured hands-on lab sessions designed to build job-ready skills.
Up-to-Date Knowledge
Our trainers continuously update the curriculum with the latest Power BI features, Python libraries, SQL techniques, AI-assisted analytics, business intelligence tools, cloud-based analytics platforms, and modern data analysis best practices to ensure learners develop industry-relevant skills that meet current market demands.
Data Analytics Certifications
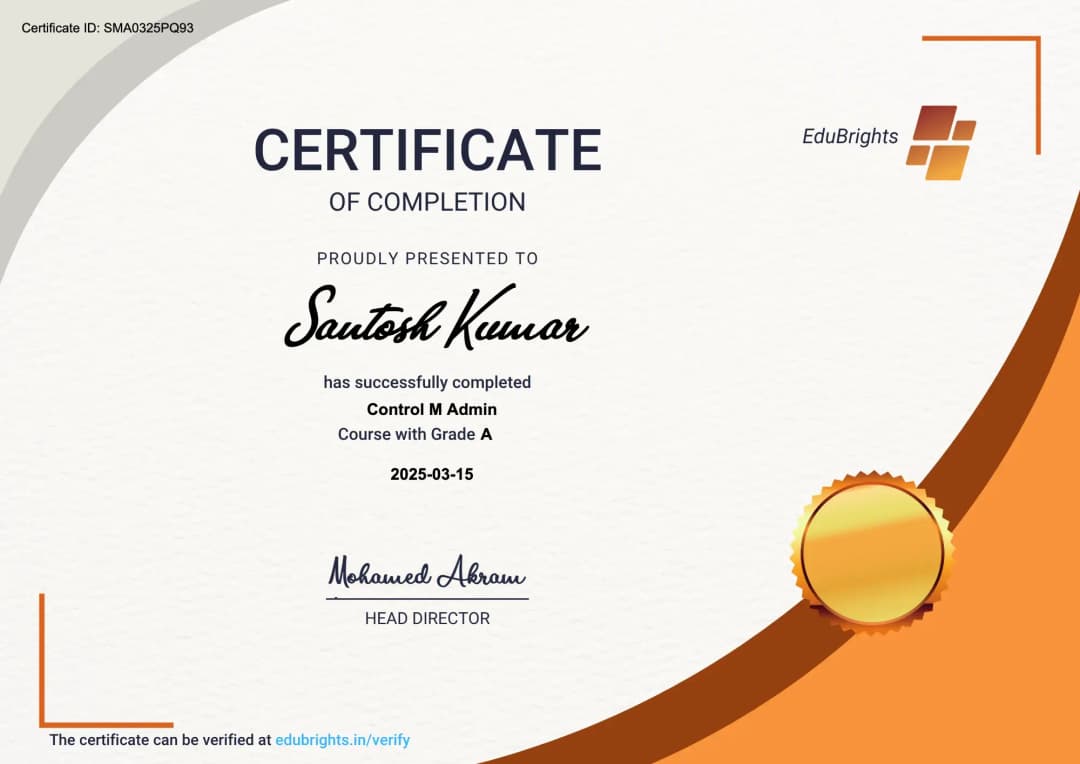
Our **Data Analytics Course** includes an industry-recognized certification from **Edubrights** upon successful course completion. The certification validates your practical knowledge in **Microsoft Excel, SQL, Python, Power BI, data visualization, business intelligence, dashboard development, and data analysis**. It strengthens your resume, showcases your technical expertise to employers, and helps you stand out for roles such as **Data Analyst, Business Analyst, Business Intelligence Analyst, Reporting Analyst, and Power BI Developer**. Through hands-on projects, real-world case studies, and practical assessments, you will gain the confidence and job-ready skills required to succeed in today's data-driven industry.
Course FAQs
1. What is Data Analytics?
Data Analytics is the process of collecting, cleaning, transforming, analyzing, and interpreting data to discover useful patterns, trends, and insights.
2. Why is Data Analytics important?
Data Analytics helps organizations understand performance, identify trends, detect problems, measure results, and make data-driven decisions.
3. What are the four types of Data Analytics?
The four major types are descriptive, diagnostic, predictive, and prescriptive analytics. Each type answers a different question about data and decision-making.
4. What is descriptive analytics?
Descriptive analytics examines historical data to understand what has happened. Examples include monthly sales reports, customer counts, and performance summaries.
5. What is diagnostic analytics?
Diagnostic analytics investigates data to understand why something happened. Analysts may compare different factors, identify relationships, and investigate unusual changes.
6. What is predictive analytics?
Predictive analytics uses historical data, statistical techniques, and machine learning methods to estimate possible future outcomes.
7. What is prescriptive analytics?
Prescriptive analytics goes beyond predicting outcomes by analyzing possible actions and their potential consequences to support decision-making.
8. What is structured data?
Structured data is organized in a predefined format, usually rows and columns. Relational database tables and spreadsheets are common examples.
9. What is unstructured data?
Unstructured data does not follow a fixed tabular structure. Examples include text documents, emails, images, videos, and audio files.
10. What is semi-structured data?
Semi-structured data does not follow a strict table structure but contains organizational elements such as tags or key-value pairs. JSON and XML are common examples.
11. What is a dataset?
A dataset is a collection of related data organized for analysis. It may contain rows representing observations and columns representing variables or attributes.
12. What is data preprocessing?
Data preprocessing involves preparing raw data for analysis by performing operations such as cleaning, transforming, integrating, and formatting data.
13. What is data cleaning?
Data cleaning is the process of identifying and correcting inaccurate, incomplete, duplicated, inconsistent, or incorrectly formatted data.
14. How are missing values handled in Data Analytics?
Missing values can be handled by removing records, replacing values using statistical methods, using domain-specific values, or treating missingness as a separate category when appropriate.
15. What are duplicate records?
Duplicate records are repeated entries representing the same observation or entity. Identifying and handling duplicates helps prevent incorrect calculations and misleading results.
16. What is data transformation?
Data transformation converts data from one structure, format, or representation into another form that is more suitable for analysis.
17. What is data normalization?
Data normalization can refer to transforming numerical values to a comparable scale. In database design, normalization has a different meaning and is used to organize relational data.
18. What is data aggregation?
Data aggregation combines multiple data records into summarized values, such as total sales, average revenue, customer counts, or monthly transaction volumes.
19. What is exploratory data analysis?
Exploratory Data Analysis (EDA) involves examining datasets to understand distributions, relationships, patterns, outliers, and potential data-quality issues.
20. What is an outlier?
An outlier is a data observation that differs substantially from other observations in a dataset. Outliers may represent errors, unusual events, or genuine extreme values.
21. How can outliers be detected?
Outliers can be identified using methods such as box plots, interquartile range (IQR), standard deviation, z-scores, and other statistical or analytical techniques.
22. What is data profiling?
Data profiling is the process of examining a dataset to understand its structure, completeness, uniqueness, data types, distributions, and quality.
23. What is a variable in Data Analytics?
A variable is a measurable characteristic or attribute that can take different values across observations, such as age, revenue, product category, or customer rating.
24. What is categorical data?
Categorical data represents groups or categories rather than continuous numerical measurements. Examples include gender, product type, department, and region.
25. What is numerical data?
Numerical data represents quantities that can be expressed as numbers, such as revenue, age, temperature, quantity, or transaction amount.
26. What is the difference between discrete and continuous data?
Discrete data consists of countable values, such as the number of customers. Continuous data can take values across a range, such as height, weight, temperature, or time.
27. What is mean, median, and mode?
Mean is the arithmetic average, median is the middle value after sorting the data, and mode is the most frequently occurring value.
28. What is standard deviation?
Standard deviation measures how widely observations are spread around the mean. A larger standard deviation generally indicates greater variability in the data.
29. What is variance?
Variance measures the average squared deviation of observations from their mean. It is commonly used to quantify variability in a dataset.
30. What is correlation?
Correlation measures the strength and direction of the relationship between two variables. It can indicate positive, negative, or weak association.
31. Does correlation mean causation?
No. Correlation does not necessarily mean that one variable causes another. Two variables can be associated because of other factors or because of coincidence.
32. What is regression analysis?
Regression analysis is a statistical technique used to examine relationships between variables and, depending on the method, estimate or predict the value of a target variable.
33. What is a hypothesis test?
A hypothesis test is a statistical method used to evaluate evidence about a population or process using sample data and a predefined hypothesis.
34. What is a confidence interval?
A confidence interval provides a range of plausible values for a population parameter based on sample data and a specified confidence level.
35. What is SQL in Data Analytics?
SQL, or Structured Query Language, is used to access, filter, transform, aggregate, and analyze data stored in relational databases.
36. What is the role of GROUP BY in SQL?
GROUP BY organizes rows into groups based on one or more columns so that aggregate calculations such as SUM, COUNT, AVG, MIN, and MAX can be performed for each group.
37. Why are SQL joins important in Data Analytics?
SQL joins allow analysts to combine information from multiple related tables. This is useful when customer, transaction, product, employee, or other business data is stored separately.
38. What is a SQL window function?
A window function performs calculations across a related set of rows while retaining the individual rows in the result. Examples include ROW_NUMBER(), RANK(), LAG(), and LEAD().
39. What is Excel used for in Data Analytics?
Excel can be used for data cleaning, calculations, filtering, pivot tables, formulas, charts, basic statistical analysis, and exploratory analysis.
40. What are PivotTables used for?
PivotTables summarize and reorganize large amounts of data, making it easier to analyze totals, averages, counts, categories, and trends across different dimensions.
41. What is Python used for in Data Analytics?
Python is commonly used for data cleaning, transformation, statistical analysis, exploratory data analysis, automation, visualization, and working with larger analytical workflows.
42. What is Pandas?
Pandas is a Python library for working with structured and tabular data. It provides tools for filtering, cleaning, transforming, grouping, merging, and analyzing datasets.
43. What is NumPy?
NumPy is a Python library designed for numerical computing. It provides multidimensional arrays and mathematical operations useful for analytical and scientific workloads.
44. What is data visualization?
Data visualization represents information using charts, graphs, maps, and other visual formats so that patterns, trends, comparisons, and relationships can be understood more easily.
45. What is a data dashboard?
A data dashboard is a visual interface that brings together important metrics, charts, tables, and other analytical information in one place.
46. What is Power BI?
Power BI is a business intelligence and data visualization platform used to connect to data sources, transform data, create data models, build reports, and develop interactive dashboards.
47. What is Power Query?
Power Query is a data preparation and transformation technology used to connect to data sources and perform operations such as filtering, merging, splitting, changing data types, and removing duplicates.
48. What is DAX?
DAX, or Data Analysis Expressions, is a formula language used in Power BI and related Microsoft analytical technologies to create measures, calculated columns, and analytical calculations.
49. What is data storytelling?
Data storytelling combines data, visualizations, and narrative to communicate analytical findings clearly. It helps audiences understand the meaning and implications of the data.
50. What is the difference between Data Analytics, Business Intelligence, and Data Science?
Data Analytics focuses on examining data to generate insights and answer analytical questions. Business Intelligence (BI) focuses heavily on reporting, dashboards, metrics, and business performance monitoring. Data Science generally covers a broader range of advanced statistical, predictive, machine learning, and computational techniques.
Get Training Quote for Free
Testimonials
Hear What Our Students Say
"Transform your life through Education, hear it from our Alumni"

6 LPA
Fathima
Student
Software Engineer
"Transform your life through Education, hear it from our Alumni"

8 LPA
Rahul
Student
Data Scientist
"Transform your life through Education, hear it from our Alumni"

8 LPA
Siddharth
NIELSON IQ
Data Analyst