Course Objectives
1. What will I learn by taking the Data Analytics course in Bangalore?
You'll build a solid understanding of the core concepts, terminology, and fundamentals of Data Analytics, giving you a strong foundation to build on.
2. What hands-on skills will I gain from the Data Analytics training?
You'll get hands-on experience with industry-relevant Data Analytics tools and workflows through guided exercises, so you learn by doing rather than just reading theory.
3. How does the Data Analytics course prepare me for real-world work?
The Data Analytics course is designed around how Data Analytics is actually applied to solve real-world problems in professional settings, not just textbook scenarios.
4. What practical, job-ready skills will I build during Data Analytics training in Bangalore?
You'll develop the practical skills needed to confidently work with Data Analytics on the job, so you're ready to contribute from day one in a Data Analytics role.
5. Will I work on real projects during the Data Analytics course?
Yes, the Data Analytics course includes real-time projects and case studies that reinforce concepts through practice, giving you portfolio-ready work by the end.
6. How does the Data Analytics course help with certification and job interviews?
The Data Analytics course is structured to help you prepare for relevant certifications and interviews, covering the concepts and terminology employers and exam boards expect.
Popular Techniques Covered in This Course
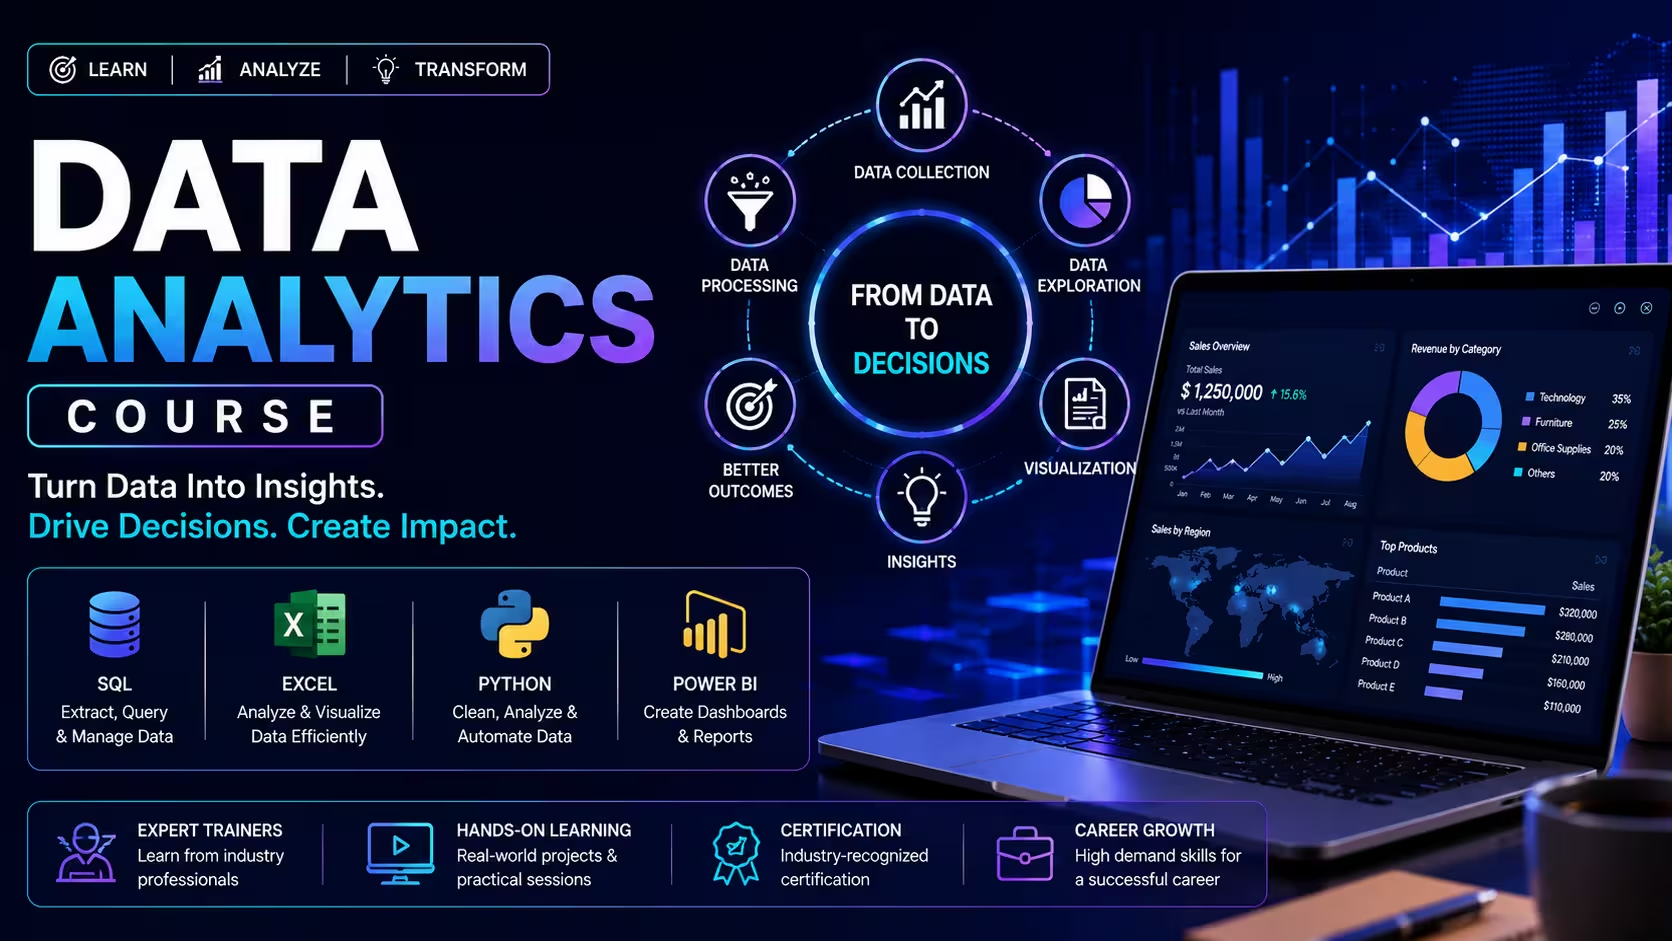
SQL (Structured Query Language)
Programming Languages: Python and R
Data Visualization Tools
Data Cleaning and Preparation
Advanced Excel Skills
Advanced SQL and Database Management
Data Transformation Engineering (dbt)
Predictive Asset Modeling
Data Storytelling & Reporting
Cloud Data Warehousing Foundations
Get Hands-on Knowledge about Real-Time Projects
Project 1
Project 1: Real-Time E-Commerce Data Pipeline
Build a production-grade pipeline to process live shopping data, customer clicks, and transactions for analytics dashboards.
Project 2
Project 2: Fraud Detection Streaming System
Design a real-time pipeline to detect fraudulent banking transactions using streaming data and anomaly detection logic.
Project 3
Project 3: End-to-End Retail Data Lakehouse
Implement Bronze-Silver-Gold architecture for retail sales, inventory, and customer analytics.
Project 4
Project 4: IoT Sensor Data Processing Pipeline
Process continuous IoT sensor data streams for predictive maintenance and system monitoring.
Project 5
Project 5: Healthcare Real-Time Analytics Platform
Build a secure pipeline to process patient data streams for real-time health insights and reporting.
Key Features
Edubrights offers Data Analyst Training in virtual mode with expert trainers. Here are the key features,
40 Hours Course Duration
100% Job Oriented Training
Industry Expert Faculties
Free Demo Class Available
Completed 500+ Batches
Certification Guidance
Curriculum
Module 1: Introduction to Data Analytics
- What is Data Analytics: Concepts, Types & Scope
- Structured vs. Unstructured Data
- Data Collection Methods and Sources
- Career Roles: Analyst, BI Analyst, Data Engineer
- Data-Driven Decision Making in Business
Module 2: Statistics & Probability for Analysts
- Descriptive Statistics: Mean, Median, Mode, Standard Deviation
- Probability Basics and Distributions
- Hypothesis Testing and Confidence Intervals
- Correlation and Regression Fundamentals
- A/B Testing for Business Decisions
Module 3: Excel for Data Analysis
- Core Formulas, Functions, Filtering & Sorting
- Pivot Tables and Pivot Charts
- Data Cleaning and Preprocessing in Excel
- Power Query for Data Transformation
- Building Dynamic Dashboards and Reports
Module 4: SQL & Database Management
- Relational Databases: Tables, Keys, Schemas
- Core Queries: SELECT, INSERT, UPDATE, DELETE
- Joins, Subqueries and CTEs
- Aggregations, Window Functions & GROUP BY
- Query Optimization and Indexing Basics
Module 5: Python for Data Analysis
- Python Basics: Variables, Loops, Functions
- NumPy and Pandas for Data Manipulation
- Data Cleaning, Wrangling and Preprocessing
- Exploratory Data Analysis (EDA)
- Matplotlib and Seaborn for Visualization
Module 6: Power BI & Data Visualization
- Power BI Interface: Reports, Data & Model Views
- Connecting and Transforming Data (Power Query)
- DAX Fundamentals: Measures and Calculated Columns
- Building Interactive Dashboards and Visuals
- Publishing, Sharing and Collaboration in Power BI
Module 7: Advanced SQL & Python
- Advanced SQL: Stored Procedures, Views, Triggers
- Connecting Python to SQL Databases
- Automating Data Workflows with Python
- Statistical Analysis with SciPy and Statsmodels
- Building End-to-End Analysis Pipelines
Module 8: Data Storytelling & Reporting
- Principles of Effective Data Visualization
- Choosing the Right Chart for the Right Data
- Structuring Business Reports and Presentations
- Dashboards for Stakeholders and Executives
- Communicating Insights Clearly and Concisely
Module 9: Intro to Machine Learning for Analysts
- What Analysts Need to Know About ML
- Linear and Logistic Regression with Python
- Clustering for Customer Segmentation
- Basic Time Series Analysis and Forecasting
- Model Evaluation and Interpreting Results
Module 10: Capstone Projects & Portfolio
- End-to-End Real-World Business Projects
- Sales, Marketing and Operations Case Studies
- Building a GitHub / Portfolio of Work
- Interview Prep: SQL Challenges and Case Studies
- Resume, LinkedIn and Job Application Guidance
Receive Training From Our Skilled and Effective Trainers
Learn from Experienced Data Analytics Professionals
Gain practical expertise from experienced Data Analytics professionals in Bangalore who have successfully delivered analytics, business intelligence, reporting, and data visualization projects across banking, healthcare, retail, manufacturing, e-commerce, telecommunications, finance, and consulting organizations. Learn real-world analytics methodologies, business reporting techniques, and data-driven decision-making practices used by leading enterprises.
Industry Exposure with Real-World Analytics Projects
Our Data Analytics trainers in Bangalore have extensive hands-on experience working with Microsoft Excel, SQL, Python, Power BI, business intelligence platforms, reporting solutions, dashboard development, and enterprise analytics projects. Learn industry best practices adopted by leading technology companies, consulting firms, and global organizations.
Simple, Practical & Business-Oriented Teaching Approach
Core Data Analytics concepts—including Excel, SQL, Python, Power BI, data cleaning, data transformation, exploratory data analysis (EDA), business reporting, dashboard development, KPI analysis, data visualization, and statistical analysis—are taught through live demonstrations, real-world business scenarios, and practical case studies. This hands-on approach helps learners understand how data analytics is applied in real business environments.
Hands-On Real-Time Data Analytics Projects
Develop job-ready skills through structured lab sessions and industry-focused projects covering Excel Dashboards, SQL Querying, Python for Data Analysis, Power BI Dashboards, Data Cleaning, Data Visualization, Business Intelligence, Reporting Automation, KPI Tracking, Sales Analytics, Customer Analytics, Financial Analytics, Marketing Analytics, and complete end-to-end analytics projects using real business datasets.
Updated with the Latest Analytics Technologies
Our Data Analytics curriculum is continuously updated with the latest Power BI features, Python libraries, SQL techniques, AI-assisted analytics, cloud-based business intelligence tools, modern data visualization practices, and industry best practices. This ensures learners develop practical, job-ready, and industry-relevant analytics skills that are highly valued by organizations in Bangalore and across the global job market.
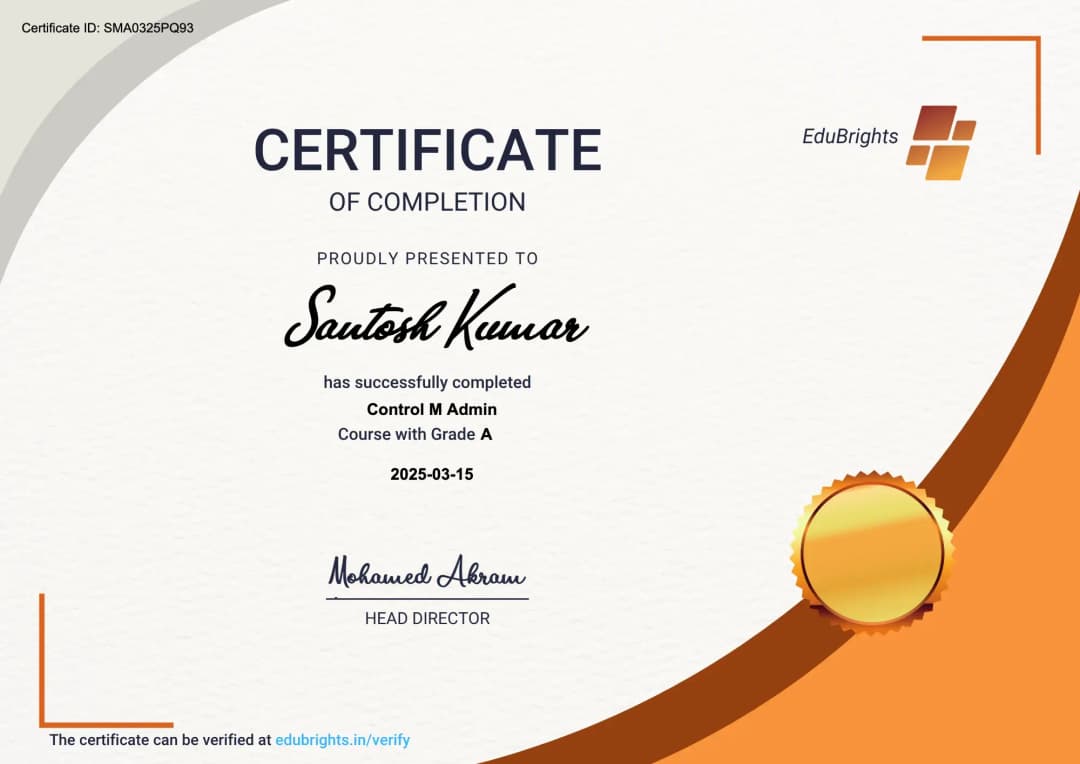
Databricks Advanced Data Engineering – Production Pipelines Certification
Our institution offers a recognized Data Analytics certification. This certification enhances your portfolio and prepares you for collaborative projects in real-world environments. Gain practical skills through hands-on training and assessments.
Course FAQs
Q1: What is the total fee for the Data Analytics Course in Bangalore at Edubrights?
A: The total fee for our comprehensive Data Analytics Course in Bangalore is ₹19,800 after applying our current 20% discount from the original price of ₹26,000. This all-inclusive cost covers live instructor-led training, access to our learning management system, study materials, certification guidance, and dedicated placement support without any hidden charges or extra fees for projects.
Q2: How does Edubrights compare to others for Data Analytics training in Bangalore?
A: Edubrights offers a more personalized and project-intensive learning experience tailored for the competitive Bangalore tech market. We focus on building a tangible GitHub portfolio with five production-grade projects, whereas many competitors focus primarily on theoretical completion. Our trainers are active professionals from top Bangalore-based MNCs who provide real-time industry insights, and we offer superior career branding services including LinkedIn optimization that goes beyond standard placement assistance.
Q3: Is there an installment or EMI option available for the course fee?
A: Yes, we understand that financial flexibility is important for students and working professionals, which is why we offer easy EMI options for our Data Analytics Course in Bangalore. You can spread the payment of ₹19,800 over several months without interest, making it easier to manage your finances while investing in your career growth without immediate financial burden.
Q4: Do you offer a free demo class before I enroll?
A: Absolutely, we believe in letting you experience our teaching quality before making a commitment. We offer a free demo class where you can interact with our expert trainers, understand the curriculum structure, and see how our live sessions are conducted. This allows you to assess whether our teaching style and course content align with your learning preferences and career goals.
Q5: What are the batch timings available for working professionals in Bangalore?
A: We offer flexible batch timings specifically designed for working professionals in Bangalore’s busy IT sector. You can choose from weekday evening batches or dedicated weekend batches that allow you to learn without interfering with your job responsibilities. Additionally, our fast-track options enable you to complete the course in six weeks if you prefer an intensive learning schedule.
Q6: Is prior coding knowledge required to join this course?
A: No prior coding knowledge is required to join our Data Analytics Course as we start from the absolute basics and gradually build your skills. We guide you through foundational concepts in Excel and SQL before introducing Python, ensuring that even complete beginners can comfortably grasp programming logic and data manipulation techniques without feeling overwhelmed.
Q7: Which tools and technologies are covered in the curriculum?
A: Our curriculum covers the most in-demand tools in the Bangalore analytics market, including Advanced Excel for data preprocessing, SQL for database querying, Python for statistical analysis and automation, and Power BI for interactive data visualization. We also introduce you to concepts like Data Transformation Engineering using dbt and cloud data warehousing foundations to ensure you are ready for modern data roles.
Q8: Do you provide placement assistance in Bangalore?
A: Yes, we provide 100% job-oriented placement assistance that includes resume building, LinkedIn profile optimization, mock interviews, and direct job referrals. Our trainers leverage their professional networks in Bangalore’s top tech companies to help you secure interviews, and we prepare you specifically for the technical rounds common in Bangalore-based MNCs.
Q9: What is the duration of the Data Analytics Course?
A: The standard duration of our Data Analytics Course is approximately two to three months, covering around 40 hours of intensive live training. However, for those who wish to upskill quickly, we offer a fast-track batch that can be completed in just six weeks, allowing you to enter the job market sooner without compromising on the depth of learning.
Q10: Are the classes live or pre-recorded?
A: All our classes are 100% live instructor-led sessions to ensure maximum engagement and real-time doubt resolution. This interactive format allows you to ask questions immediately, receive feedback on your code, and participate in discussions with peers, which is significantly more effective than watching pre-recorded videos where interaction is limited.
Q11: Will I get a certificate after completing the course?
A: Yes, upon successful completion of the course and projects, you will receive a certification that validates your skills in Data Analytics. This certificate, combined with your GitHub portfolio of real-world projects, serves as strong proof of your competence to potential employers in Bangalore’s competitive job market.
Q12: What kind of projects will I work on during the course?
A: You will work on five real-time, production-grade projects that simulate actual industry challenges. These include building an e-commerce data pipeline, designing a fraud detection streaming system for banking, implementing a retail data lakehouse with Medallion Architecture, processing IoT sensor data, and creating a healthcare real-time analytics platform. These projects are designed to give you hands-on experience with complex data scenarios.
Q13: Do you teach Machine Learning in this course?
A: Yes, our curriculum includes a dedicated module on Introduction to Machine Learning for Analysts. You will learn practical applications of Linear and Logistic Regression, Clustering for customer segmentation, and Time Series Analysis using Python, ensuring you have the predictive modeling skills required for advanced analyst roles in Bangalore’s tech companies.
Q14: Who are the trainers at Edubrights?
A: Our trainers are industry experts with over ten years of experience working in top multinational corporations such as TCS, Infosys, Wipro, and Accenture in Bangalore. They bring real-world case studies and current industry practices into the classroom, ensuring that you learn relevant skills that are directly applicable to your future job roles.
Q15: Is SQL difficult to learn for beginners?
A: SQL is designed to be user-friendly and is one of the easiest programming languages to learn, especially for beginners. Our course breaks down SQL concepts into simple, manageable modules starting with basic queries and progressively moving to advanced joins and window functions, ensuring that you build confidence and proficiency step by step.
Q16: Do you cover Power BI or Tableau for visualization?
A: Our course focuses extensively on Power BI, which is widely used in Bangalore’s corporate sector for its integration with Microsoft ecosystems. You will learn to connect data sources, transform data using Power Query, create DAX measures, and build interactive dashboards that effectively communicate business insights to stakeholders.
Q17: Can freshers with no experience join this course?
A: Yes, our course is perfectly suited for freshers who want to launch their careers in data analytics. We provide foundational training in statistics and data concepts, along with practical projects that help you build a strong portfolio, making you job-ready even without prior work experience.
Q18: What is the average salary for a Data Analyst in Bangalore after this course?
A: While salaries vary based on individual performance and company policies, entry-level Data Analysts in Bangalore typically start with packages ranging from ₹4 lakhs to ₹8 lakhs per annum. With the advanced skills and portfolio you build in our course, you are well-positioned to negotiate better offers and aim for higher starting salaries.
Q19: Do you help with resume building?
A: Yes, resume building is a critical part of our placement support. We help you craft a professional resume that highlights your technical skills, real-time projects, and certifications effectively. Our experts guide you on how to present your achievements to stand out in the crowded Bangalore job market.
Q20: Is there any prerequisite for joining the course?
A: There are no strict prerequisites for joining our course other than a basic interest in data and logical thinking. A bachelor’s degree in any field is helpful but not mandatory, as we teach all necessary technical skills from scratch. Familiarity with basic computer operations is sufficient to start your learning journey with us.
Q21: How is the course different from online self-paced courses?
A: Unlike self-paced online courses where you learn in isolation, our live instructor-led model provides real-time interaction, immediate doubt resolution, and peer collaboration. Additionally, our focus on building a verified GitHub portfolio and personalized career coaching offers a level of support and accountability that self-paced platforms cannot match.
Q22: Do you offer any discounts for students?
A: Yes, we currently offer a 20% discount on our course fee, bringing it down to ₹19,800. We also provide additional concessions for students who enroll in groups or refer friends, making quality education more affordable for everyone.
Q23: What is Medallion Architecture and why is it important?
A: Medallion Architecture is a data design pattern that organizes data into Bronze, Silver, and Gold layers for improved data quality and performance. Learning this concept is crucial as it is widely used in modern data lakes and warehouses, and understanding it gives you a significant advantage when applying for roles in companies using big data technologies.
Q24: Will I learn Python for data analysis?
A: Yes, Python is a core component of our curriculum. You will learn Python basics, data manipulation using Pandas and NumPy, and data visualization with Matplotlib and Seaborn. This hands-on training ensures you can automate data workflows and perform advanced statistical analysis efficiently.
Q25: Do you provide study materials?
A: Yes, we provide comprehensive study materials including slide decks, code snippets, dataset links, and reference guides. These resources are accessible via our Learning Management System, allowing you to review lessons and practice exercises at your own pace even after the live sessions end.
Q26: How do I access the recorded sessions if I miss a class?
A: All live sessions are recorded and uploaded to our Learning Management System within 24 hours. You can access these recordings anytime to revise topics, catch up on missed classes, or clarify doubts, ensuring that you never fall behind in your learning journey.
Q27: Is there any group discussion or soft skills training?
A: Yes, we incorporate soft skills training and group discussions into our curriculum to prepare you for corporate environments. You will learn how to communicate data insights effectively, present dashboards to stakeholders, and collaborate in team settings, which are essential skills for any successful data analyst.
Q28: What companies hire Data Analysts in Bangalore?
A: Bangalore is home to numerous top tech companies that actively hire Data Analysts, including Amazon, Flipkart, Swiggy, Zomato, IBM, Accenture, and many startups. Our placement support is tailored to help you target these companies by aligning your skills with their specific requirements.
Q29: Can I switch careers from non-IT to Data Analytics?
A: Absolutely, many of our successful students have switched from non-IT backgrounds such as sales, finance, and operations to data analytics. Our course is designed to bridge the gap by teaching technical skills while leveraging your domain knowledge, making you a valuable asset to companies looking for analysts with business acumen.
Q30: Do you offer internship opportunities?
A: While we primarily focus on full-time job placements, we do provide guidance on securing internships and often share internship opportunities from our hiring partners. Our project-based learning also serves as practical experience that can be highlighted as internship-like work on your resume.
Q31: What is the role of Statistics in Data Analytics?
A: Statistics is the foundation of data analytics, helping you understand data distributions, trends, and relationships. Our course covers descriptive statistics, probability, hypothesis testing, and regression analysis, enabling you to make data-driven decisions and validate your findings scientifically.
Q32: Will I learn how to clean messy data?
A: Yes, data cleaning is a critical skill that we emphasize heavily in our course. You will learn techniques to handle missing values, remove duplicates, correct inconsistencies, and transform raw data into usable formats using Excel, SQL, and Python, ensuring your analysis is based on accurate information.
Q33: How do I build a portfolio for Data Analytics?
A: We guide you through building a professional GitHub portfolio where you upload your five real-time projects with detailed documentation. This portfolio serves as a visual proof of your skills, allowing recruiters to see your code, methodology, and problem-solving abilities directly.
Q34: Is the course suitable for business analysts?
A: Yes, the course is highly beneficial for business analysts looking to upgrade their technical skills. By learning SQL, Python, and Power BI, you can automate reporting, perform deeper analysis, and provide more strategic insights, thereby enhancing your value within your organization.
Q35: Do you teach advanced Excel functions?
A: Yes, we cover advanced Excel functions including Pivot Tables, VLOOKUP, XLOOKUP, Power Query, and macro basics. These skills are essential for quick data analysis and are still widely used in many organizations alongside more advanced tools.
Q36: What is the difference between Data Analytics and Data Science?
A: Data Analytics focuses on analyzing historical data to answer specific business questions and generate insights, while Data Science involves building predictive models and algorithms using machine learning. Our course covers both descriptive analytics and introductory machine learning, giving you a solid foundation in both areas.
Q37: Can I attend classes from outside Bangalore?
A: Yes, our live online classes are accessible from anywhere, so you can join from outside Bangalore if you prefer remote learning. The interaction and quality of training remain the same, and you still receive full placement support for jobs in Bangalore or other locations.
Q38: How often are new batches started?
A: We start new batches frequently, including weekday, weekend, and fast-track options. You can contact our admissions team to get the exact start dates for the upcoming batches and choose the one that fits your schedule best.
Q39: Do you provide mock interviews?
A: Yes, we conduct rigorous mock interviews that simulate real job interviews. These include technical rounds focusing on SQL queries and Python coding, as well as HR rounds to prepare you for behavioral questions, boosting your confidence and performance in actual interviews.
Q40: What is the success rate of placements?
A: We have a strong track record of placing students in top companies, with hundreds of successful placements across various industries. Our focus on practical skills and portfolio building ensures that our students are highly competitive in the job market.
Q41: Will I learn about data storytelling?
A: Yes, Module 8 is dedicated to Data Storytelling and Reporting, where you learn how to present data insights clearly and persuasively. You will understand how to choose the right visuals, structure reports, and communicate findings to non-technical stakeholders effectively.
Q42: Is there any support after course completion?
A: Yes, our support continues even after course completion. We provide ongoing career guidance, access to alumni networks, and updates on new industry trends and tools, ensuring you stay relevant and continue to grow in your career.
Q43: What is the minimum qualification required?
A: A bachelor’s degree in any discipline is generally preferred by employers, but it is not a strict requirement for joining our course. We have successfully trained students from various educational backgrounds, including diplomas and undergraduate degrees in arts, commerce, and science.
Q44: Do you teach cloud data warehousing?
A: Yes, we introduce you to Cloud Data Warehousing Foundations, giving you an overview of how data is stored and managed in cloud environments like AWS or Azure. This knowledge is increasingly important as more companies move their data infrastructure to the cloud.
Q45: How do I register for the course?
A: You can register by visiting our website, filling out the inquiry form, or calling our admissions team directly. Our counselors will guide you through the enrollment process, explain the payment options, and help you choose the best batch for your needs.
Q46: Will I learn about A/B testing?
A: Yes, A/B testing is covered in our Statistics module as a key technique for business decision-making. You will learn how to design experiments, analyze results, and determine the statistical significance of differences between groups, which is crucial for product and marketing analytics.
Q47: Is the certification recognized by companies?
A: Our certification is industry-recognized and valued by hiring partners who know the rigor of our training. However, we emphasize that your GitHub portfolio and practical skills are equally, if not more, important in securing a job, and we ensure you excel in both areas.
Q48: Do you teach data transformation using dbt?
A: Yes, we introduce you to Data Transformation Engineering using dbt (data build tool), which is becoming a standard in modern data stacks. This skill allows you to manage data transformations in your warehouse efficiently, making you more versatile and appealing to modern tech companies.
Q49: What makes Edubrights the best choice in Bangalore?
A: Edubrights stands out due to our combination of experienced industry trainers, real-world production-grade projects, personalized career support, and affordable pricing. We focus on holistic development, ensuring you not only learn technical skills but also build a strong professional presence that attracts recruiters.
Q50: Can I talk to a former student for reference?
A: Yes, we can connect you with our alumni network so you can hear firsthand about their learning experience and career progression. Speaking with former students can give you valuable insights into how the course helped them achieve their goals and what to expect from our training.
Get Training Quote for Free
Testimonials
Hear What Our Students Say
"Transform your life through Education, hear it from our Alumni"

6 LPA
Fathima
Student
Software Engineer
"Transform your life through Education, hear it from our Alumni"

8 LPA
Rahul
Student
Data Scientist
"Transform your life through Education, hear it from our Alumni"

8 LPA
Siddharth
NIELSON IQ
Data Analyst