Course Objectives
1. What exactly Tableau training cover?
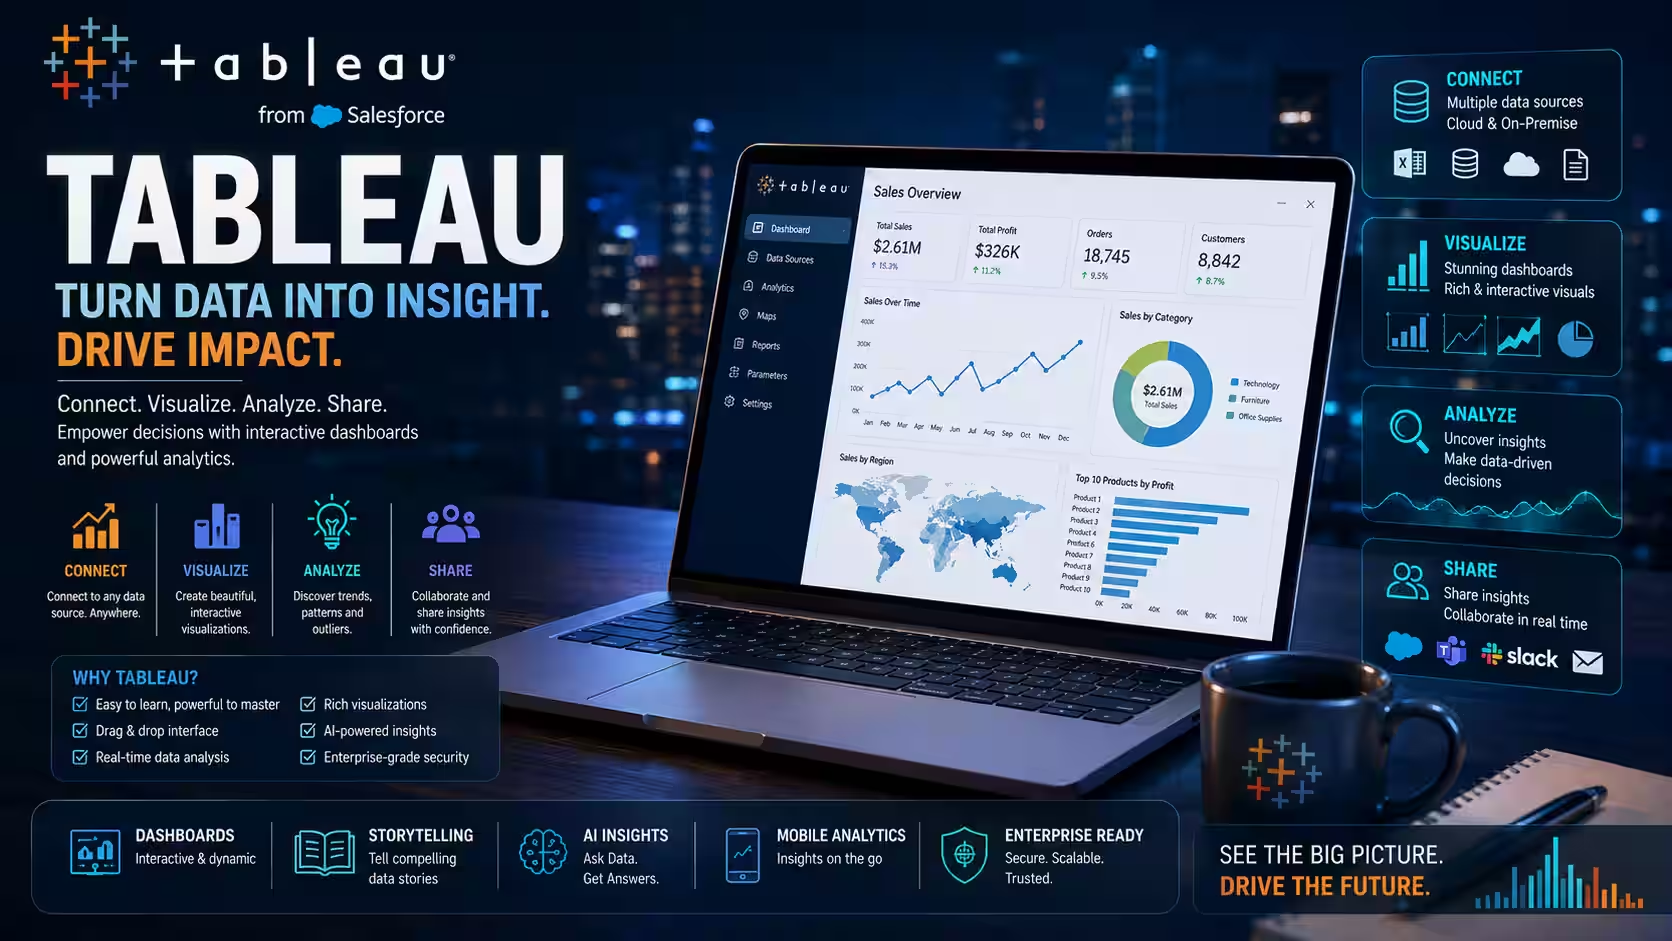
Tableau training covers data visualization, dashboard creation, data blending, calculated fields, and interactive reporting using Tableau software
2. What are the main objectives of the Tableau course for your development skills?
The course aims to develop your skills in designing impactful visualizations, building dashboards, analyzing data effectively, and sharing insights through Tableau.
3. Master Visual Analysis and Canvas Mechanics
Discover how to navigate the drag-and-drop worksheet canvas, build complex dual-axis charts, and implement visual design best practices.
4. Isolate Granular Data Trends
Build precise calculations using logical conditions, aggregate functions, and high-level Level of Detail (LOD) syntax to uncover deep-seated business patterns.
Popular Techniques Covered in This Course
1.Data connection and blending
2.Visualization creation
3.Calculated fields and table calculations
4.Dashboard design
5.Storytelling with data
6.Publishing and sharing
7.Performance optimization
8.Mapping and geographic visualization
9.Parameters and interactivity
10.Certification readiness
Get Hands-on Knowledge about Real-Time Projects
Project 1
PROJECT : 1
Create a sales performance dashboard with multiple data sources.
Project 2
PROJECT : 2
Build an interactive customer segmentation report using calculated fields.
Project 3
Project 3
Construct a robust data tracking system to process multi-million row financial ledgers. You will write complex LOD expressions to monitor year-over-year revenue shifts while locking comparison fields to specific customer cohorts across variable fiscal calendars.
Project 4
Project 4
Design an interactive reporting dashboard to analyze healthcare resource allocation numbers. You will map out responsive user actions and drill-through paths, letting hospital directors filter clinic capacities, bed spaces, and staff distributions instantly.
Project 5
Project 5
Create a secure enterprise server folder system to share regional sales summaries worldwide. You will program dynamic user filters that read security clearance profiles, making sure regional division heads only view the private data rows assigned to their physical territory.
Key Features
Edubrights offers Tableau Training in virtual mode with expert trainers. Here are the key features,
40 Hours Course Duration
100% Job Oriented Training
Industry Expert Faculties
Free Demo Class Available
Completed 500+ Batches
Certification Guidance
Curriculum
Module 1: Introduction to Tableau
- Overview of Tableau and its ecosystem
- Installing and navigating Tableau Desktop
Module 2: Connecting to Data Sources
- Importing data from files and databases
- Live connection vs extracts
Module 3: Data Preparation and Blending
- Data cleaning and transformation
- Joining and blending data sources
Module 4: Basic Visualizations
- Creating charts: bar, line, scatter, pie
- Formatting and customizing visuals
Module 5: Calculated Fields and Quick Table Calculations
- Writing formulas in Tableau
- Using aggregations and table calculations
Module 6: Advanced Visualizations
- Maps, dual-axis charts, sets, and parameters
Module 7: Building Dashboards and Stories
- Designing interactive dashboards
- Using filters, actions, and parameters
Module 8: Sharing and Publishing
- Publishing to Tableau Server and Tableau Online
- Setting permissions and scheduling extract refreshes
Module 9: Performance Optimization and Best Practices
- Improving dashboard performance
- Visualization best practices
Module 10: Hands-on Projects & Certification Preparation
- Real-world scenarios and exercises
- Exam tips and sample questions
Receive Training From Our Skilled and Effective Trainers
Experience in the Industry Gain knowledge from experts with practical Tableau project experience in a variety of sectors.
Backgrounds at the Top Prominent corporations such as hcl, tcs , accenture and cognizant employ trainers.
Clear & Effective Teaching Excellent communication and real-world examples simplify complex subjects.
Hands-On Learning Focus Students can apply their abilities in real-world situations with the use of case studies and real-time projects.
Up-to-Date Knowledge Trainers stay current with the latest tools, techniques and best practices.
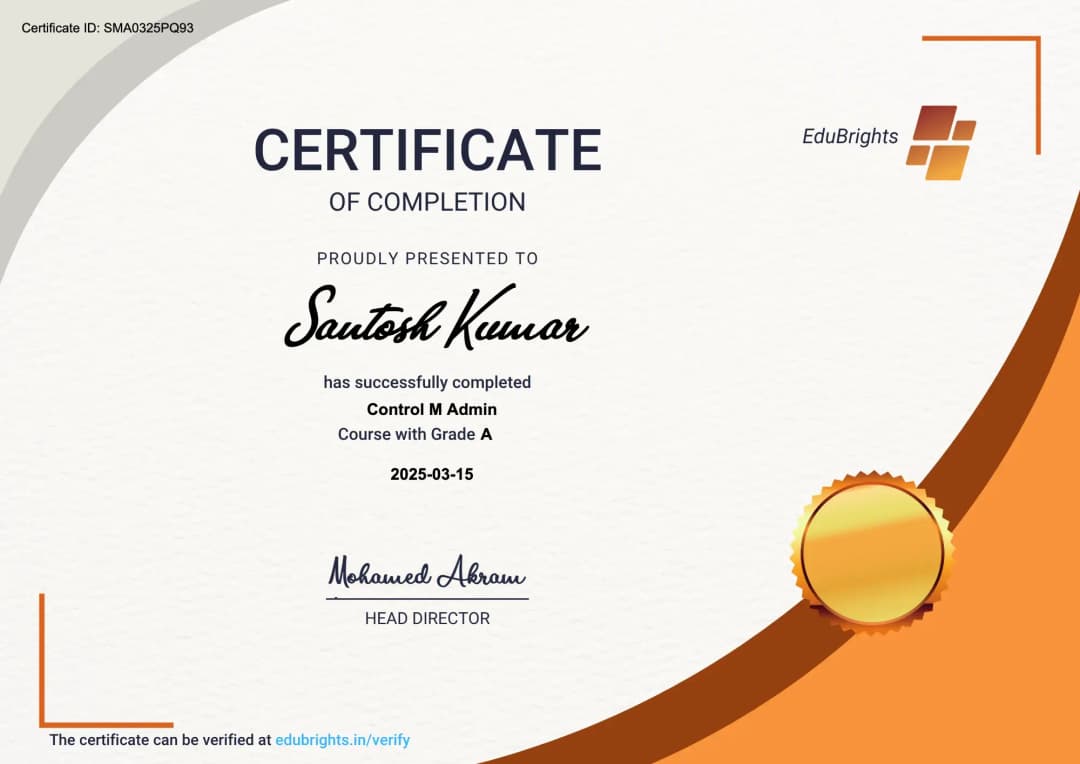
Succeed Our Resourceful Certification
Our certification validates your expertise in Tableau data visualization and dashboard development. It prepares you for roles in business intelligence and data analytics.
Course FAQs
1. What is Tableau?
A leading data visualization and business intelligence tool.
2. Who should learn Tableau?
Business analysts, data scientists, and managers.
3. Can Tableau connect to multiple data sources?
Yes, from files to cloud databases.
4. Does the course cover dashboard creation?
Yes, including interactive elements.
5. Will I learn calculated fields?
Yes, for custom metrics and logic
6. Is data blending part of the training?
Yes, combining multiple datasets.
7. Does it teach publishing and sharing reports?
Yes, including Tableau Server and Online.
8. Are performance tips included?
Yes, for fast and responsive dashboards.
9. Does it include hands-on projects?
Yes, practical real-world examples.
10. Is certification preparation provided?
Yes, with study resources and tips.
11. What are Tableau Parameters and how do they make charts interactive?
Parameters act as user input text boxes or slider variables. Instead of a fixed filter, a parameter lets your users dynamically alter entire calculations, switch chart axes, or adjust performance threshold numbers on the fly.
12. Can I take this course while working a full-time corporate job?
Yes. EduBrights hosts flexible weekend and evening lecture shifts built specifically for professional schedules. All live feeds are recorded in high-definition and uploaded to your personal dashboard within 3 hours.
13. What is the main difference between an Extract and a Live connection?
A Live connection runs queries directly against your database in real-time, which is ideal for constant updates but can slow down big files. An Extract takes a highly compressed snapshot file of that data, speeding up chart loads significantly.
Get Training Quote for Free
Testimonials
Hear What Our Students Say
"Transform your life through Education, hear it from our Alumni"

6 LPA
Fathima
Student
Software Engineer
"Transform your life through Education, hear it from our Alumni"

8 LPA
Rahul
Student
Data Scientist
"Transform your life through Education, hear it from our Alumni"

8 LPA
Siddharth
NIELSON IQ
Data Analyst