Course Objectives
1. Understand Siebel Analytics and Business Intelligence Fundamentals
Learn the core concepts of Siebel Analytics, Business Intelligence (BI), data warehousing, reporting, dashboards, and enterprise analytics. Understand how organizations use BI solutions to support strategic decision-making.
2. Configure Siebel Analytics Architecture and Components
Develop the skills required to understand and configure Siebel Analytics Server, Presentation Services, Repository (RPD), metadata layers, and reporting components.
3. Design and Develop Enterprise Reports
Learn how to create operational reports, management reports, ad hoc reports, scorecards, and interactive dashboards for business users.
4. Build Data Models and Business Layers
Understand how to create logical business models, map physical data sources, and design semantic layers that support reporting and analytics requirements.
5. Implement Dashboards and Performance Monitoring
Gain expertise in developing dashboards, KPIs, scorecards, and performance monitoring solutions that help organizations track business objectives.
Popular Techniques Covered in This Course
1. Siebel Analytics Repository (RPD) Development
2. Data Modeling and Metadata Management
3. Report Development
4. Dashboard Design and Configuration
5. KPI and Scorecard Management
6. Query and Analysis Development
7. Security and Access Control Management
8. Data Warehouse Integration
9. Performance Optimization
10. Business Intelligence Reporting Administration
Get Hands-on Knowledge about Real-Time Projects
Project 1
1. Executive Business Intelligence Dashboard Project
Develop an executive dashboard that displays KPIs, revenue trends, operational metrics, and business performance indicators for senior management.
Project 2
2. Sales Performance Analytics Project
Create reports and dashboards that analyze sales revenue, customer acquisition, sales targets, and regional performance trends.
Project 3
3. Customer Relationship Analytics Project
Build analytical reports that evaluate customer behavior, retention rates, service performance, and customer satisfaction metrics.
Project 4
4. Enterprise Data Warehouse Reporting Project
Integrate Siebel Analytics with a data warehouse and develop enterprise-wide reports for finance, sales, operations, and management teams.
Project 5
5. KPI Monitoring and Scorecard Project
Design KPI scorecards and performance monitoring dashboards that help organizations track strategic goals and operational effectiveness.
Key Features
Edubrights offers SIEBEL ANALYTICS – REPORTING & BUSINESS INTELLIGENCE Training in virtual mode with expert trainers. Here are the key features,
40 Hours Course Duration
100% Job Oriented Training
Industry Expert Faculties
Free Demo Class Available
Completed 500+ Batches
Certification Guidance
Curriculum
Module 1: Introduction to Siebel Analytics and OBIEE
- Siebel Analytics history and evolution to Oracle BI (OBIEE)
- OBIEE architecture: BI Server, Presentation Services, and Scheduler
- Repository (RPD): physical, business model, and presentation layers
- Connecting OBIEE to Siebel transactional and data warehouse sources
Module 2: Repository Development – Physical Layer
- Importing database schemas into the physical layer
- Physical table aliases and joins: star schema modelling
- Connection pool configuration and data source setup
- Physical layer best practices for Siebel data models
Module 3: Business Model and Mapping Layer
- Logical tables: facts and dimensions in the business model
- Logical joins and dimension hierarchy definition
- Logical columns and column mappings from physical sources
- Calculated measures: revenue, count, and ratio calculations
Module 4: Presentation Layer and Subject Areas
- Presentation tables, columns, and subject area organisation
- Renaming objects for business-friendly naming conventions
- Presentation layer security: object visibility by role
- Deploying the RPD and restarting BI services
Module 5: Answers – Ad Hoc Analysis
- Creating analyses: selecting columns and applying filters
- Visualisation types: table, pivot table, bar chart, and gauge
- Conditional formatting: highlighting values based on thresholds
- Saving and sharing analyses in shared and personal folders
Module 6: Dashboards and Interactive Reports
- Dashboard page creation: adding analyses, text, and images
- Dashboard prompts: dynamic filters for interactive analysis
- Guided navigation: linking dashboards with contextual drilldowns
- Dashboard permissions and publishing to user groups
Module 7: Siebel-Specific Analytics Content
- Pre-built Siebel Analytics subject areas: Sales, Service, and Marketing
- Pipeline and forecast analytics: standard Siebel BI content
- Customising Siebel Analytics: adding custom metrics and dimensions
- Siebel Analytics actions: navigating from BI to Siebel CRM records
Module 8: Capstone Project and Assessment
- RPD development: physical, business model, and presentation layers
- Dashboard build: sales pipeline analysis with prompts and drilldowns
- Siebel-specific analytics customisation and deployment exercise
- Final assessment and course certification
Receive Training From Our Skilled and Effective Trainers
Experience in the Industry Gain expertise from Oracle BI and Siebel Analytics developers who have built reporting solutions and dashboards for Siebel CRM data, enabling sales, service, and marketing performance visibility at enterprise organisations.
Backgrounds at the Top Our Siebel Analytics trainers have worked at Oracle partner consultancies and enterprise BI teams building OBIEE-based analytics solutions on top of Siebel CRM transactional and data warehouse sources.
Clear & Effective Teaching OBIEE architecture, RPD development across all three layers, Answers ad hoc analysis, dashboard creation, Siebel-specific subject areas, and security are explained with real BI reporting examples.
Hands-On Learning Focus Students build OBIEE repository layers, create analyses and dashboards, configure dashboard prompts, customise Siebel Analytics content, and deploy reports through structured hands-on BI development labs.
Up-to-Date Knowledge Trainers keep content current with the latest Oracle Analytics Server features, Oracle Analytics Cloud as the successor to OBIEE, and migration pathways for Siebel Analytics customers.
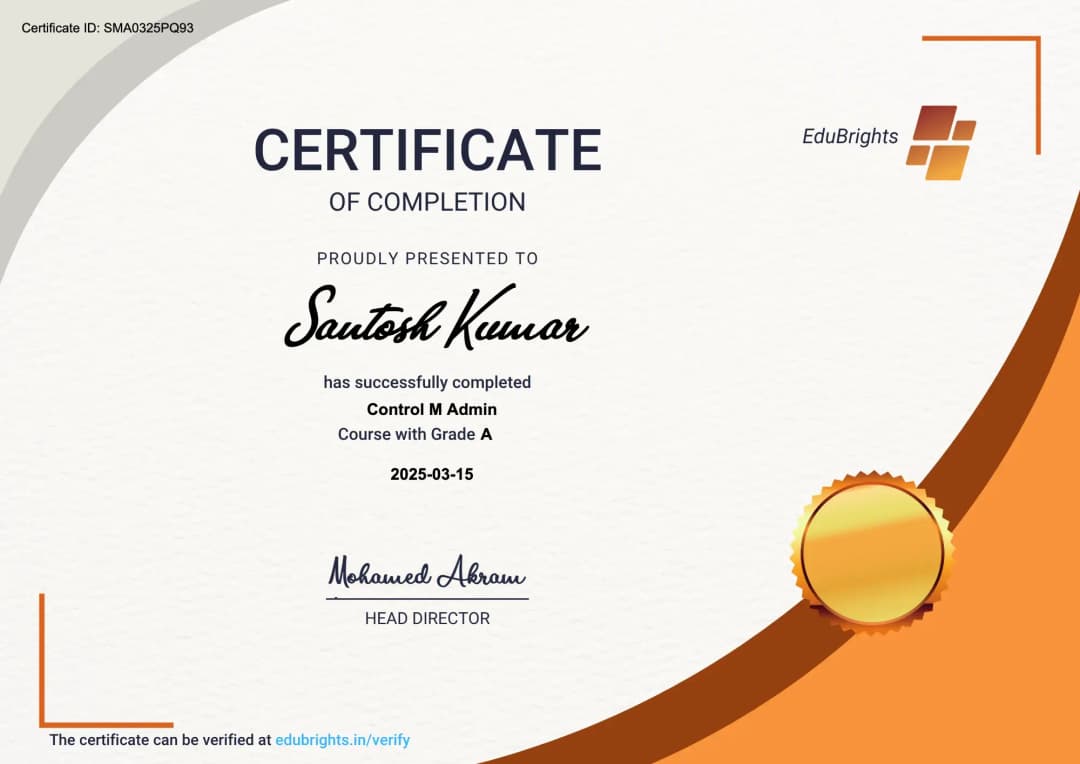
Siebel Analytics and Business Intelligence Professional Certification
Our institution offers a recognized SIEBEL ANALYTICS – REPORTING & BUSINESS INTELLIGENCE certification that validates your ability to design and prototype professional user interfaces efficiently. This certification enhances your design portfolio and prepares you for collaborative projects in real-world environments. Gain practical skills through hands-on training and assessments.
Course FAQs
1. What is Siebel Analytics?
Siebel Analytics is a Business Intelligence platform that enables organizations to analyze data, create reports, build dashboards, and support business decision-making.
2. What is Business Intelligence (BI)?
Business Intelligence is the process of collecting, analyzing, and presenting business data to help organizations make informed decisions.
3. Who should learn Siebel Analytics?
BI Developers, Data Analysts, Reporting Analysts, Business Analysts, Database Professionals, and IT Consultants can benefit from learning Siebel Analytics.
4. What is an RPD in Siebel Analytics?
RPD (Repository File) is the metadata repository that defines data sources, business models, relationships, and presentation layers used for reporting.
5. What are the three layers of Siebel Analytics Repository?
The repository consists of the Physical Layer, Business Model and Mapping Layer, and Presentation Layer.
6. What is a dashboard in Siebel Analytics?
A dashboard is a visual interface that displays reports, charts, KPIs, and performance metrics in a single consolidated view.
7. What are KPIs?
Key Performance Indicators (KPIs) are measurable values used to evaluate business performance against strategic objectives.
8. Can Siebel Analytics connect to multiple data sources?
Yes. Siebel Analytics can connect to databases, data warehouses, ERP systems, CRM systems, and other enterprise data sources.
9. What is metadata in Siebel Analytics?
Metadata describes the structure, relationships, and business meaning of data used in reports and dashboards.
10. Is coding required for Siebel Analytics?
Basic SQL knowledge is beneficial, but much of the development work focuses on repository design, reporting, and analytics configuration.
11. What reports can be created in Siebel Analytics?
Users can create operational reports, management reports, KPI reports, analytical reports, trend reports, and executive dashboards.
12. What industries use Siebel Analytics?
Banking, Telecommunications, Healthcare, Insurance, Retail, Manufacturing, Government, and Financial Services organizations use Siebel Analytics.
13. Is Siebel Analytics still relevant?
Many enterprises continue to use Siebel Analytics and related Oracle Business Intelligence solutions for reporting and analytics requirements.
14. What job roles are available after learning Siebel Analytics?
Common roles include BI Developer, Reporting Analyst, Data Analyst, Business Intelligence Consultant, Dashboard Developer, and Analytics Specialist.
15. Is Siebel Analytics in demand?
Organizations with legacy Siebel and Oracle BI environments continue to require skilled professionals for maintenance, reporting, and analytics projects.
Get Training Quote for Free
Testimonials
Hear What Our Students Say
"Transform your life through Education, hear it from our Alumni"

8 LPA
Rahul
Student
Data Scientist
"Transform your life through Education, hear it from our Alumni"

6 LPA
Fathima
Student
Software Engineer
"Transform your life through Education, hear it from our Alumni"

8 LPA
Siddharth
NIELSON IQ
Data Analyst