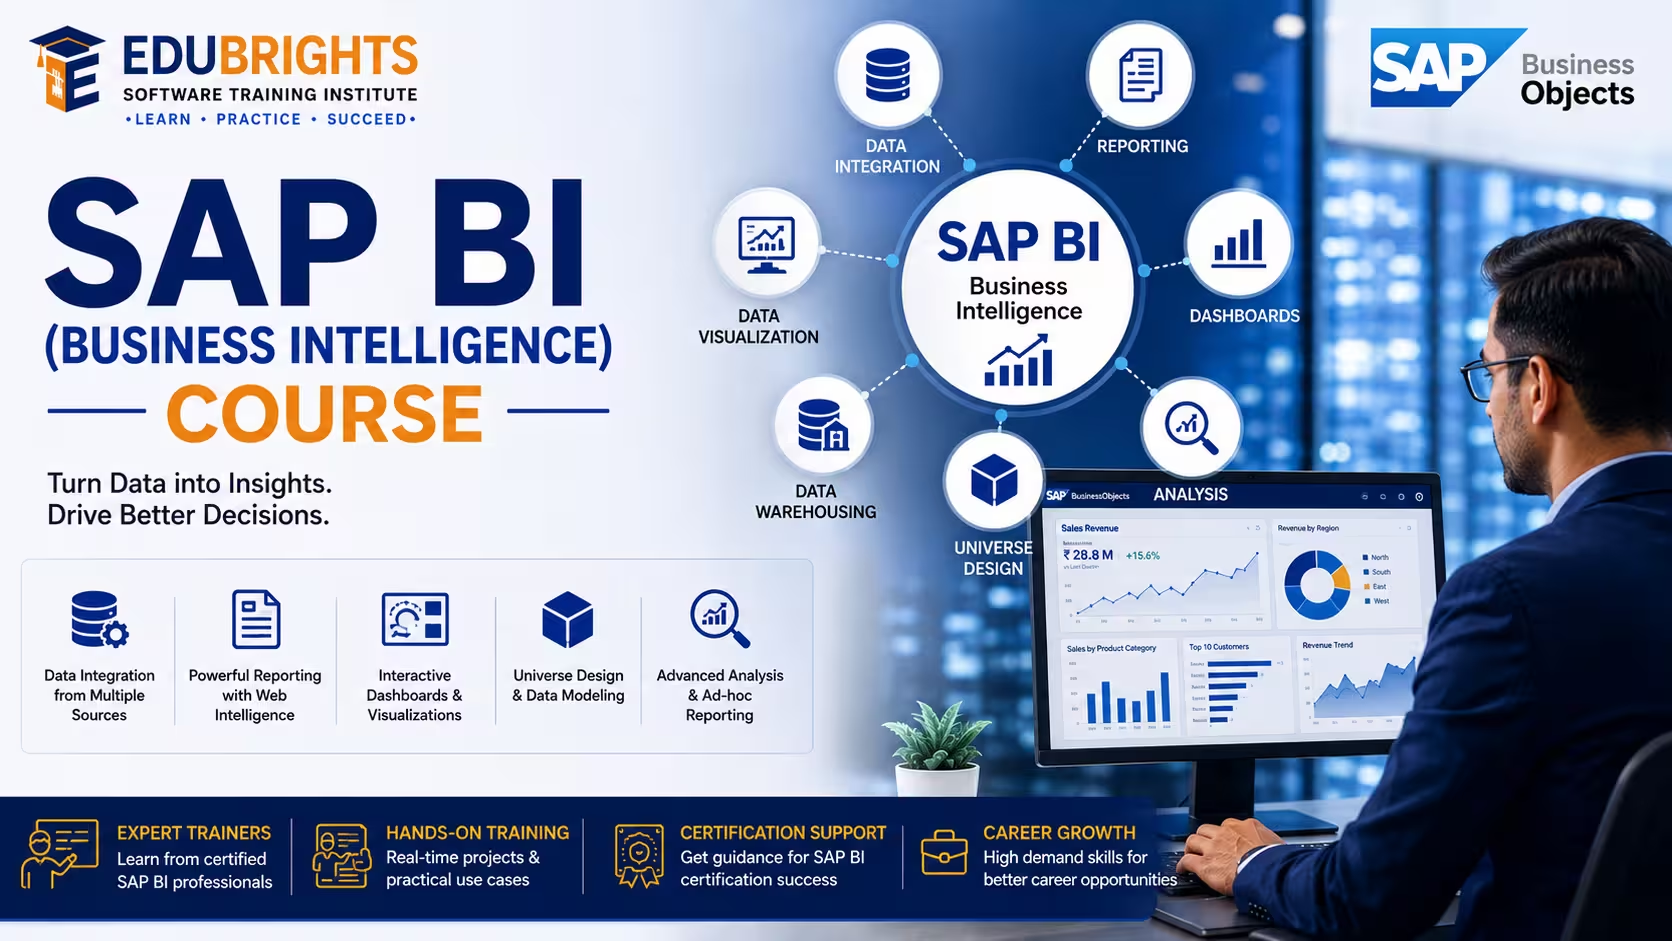
Course Objectives
1. Master SAP Business Intelligence Concepts
Learn how to collect, transform, analyze, and visualize business data using SAP BI tools and reporting solutions.
2. Develop Data Warehousing and Reporting Skills
Gain expertise in data modeling, ETL processes, data extraction, reporting, dashboard creation, and analytics.
3. Configure SAP BI Solutions for Business Insights
Understand SAP BI architecture, InfoProviders, DataSources, queries, and reporting tools to support data-driven decision-making.
4. Prepare for Real-World Analytics Projects
Work on practical business intelligence scenarios involving sales analysis, financial reporting, operational analytics, and executive dashboards.
Popular Techniques Covered in This Course
SAP BI Architecture
Data Warehousing Concepts
Data Extraction and ETL Processes
InfoObjects and InfoProviders
SAP BW Modeling
Query Design and Reporting
Dashboard Development
Business Analytics and KPI Reporting
Data Integration and Transformation
SAP BI Performance Optimization
Get Hands-on Knowledge about Real-Time Projects
Project 1
Project 1: Sales Performance Analytics Dashboard
Develop an interactive dashboard to analyze sales performance, customer trends, product profitability, and regional growth.
Project 2
Project 2: Financial Reporting and Analysis System
Create automated financial reports for revenue tracking, expense analysis, budgeting, and executive decision-making.
Project 3
Project 3: Supply Chain Analytics Solution
Build business intelligence reports that monitor inventory levels, procurement efficiency, logistics performance, and supplier metrics.
Project 4
Project 4: Human Resources Analytics Dashboard
Design HR reports to track employee performance, workforce planning, recruitment metrics, and training effectiveness.
Project 5
Project 5: Enterprise Data Warehouse Implementation
Develop a centralized data warehouse solution integrating multiple business systems for advanced reporting and analytics.
Key Features
Edubrights offers SAP BI (Business Intelligence) in virtual mode with expert trainers. Here are the key features,
40 Hours Course Duration
100% Job Oriented Training
Industry Expert Faculties
Free Demo Class Available
Completed 500+ Batches
Certification Guidance
Curriculum
Module 1: Introduction to SAP BI
- Overview of SAP Business Intelligence solutions
- SAP BI tools: BW, SAC, BusinessObjects, Lumira
- BI architecture and reporting landscape
- BI strategy and roadmap
- Integration with SAP and non-SAP data sources
Module 2: SAP BusinessObjects (BOBJ) Suite
- BOBJ components: Universe, Web Intelligence, Crystal Reports
- Central Management Console (CMC)
- User and group management
- Publication and scheduling
- BOBJ upgrade and administration
Module 3: Universe Design Tool (UDT)
- Universe creation and maintenance
- Classes, objects, and conditions
- Joins and cardinality
- Derived tables and aggregate awareness
- Universe integrity check
Module 4: Web Intelligence (WebI)
- Report creation in WebI
- Queries, filters, and variables
- Formulas and functions
- Charts and visualization
- Scheduling and distribution
Module 5: SAP Crystal Reports
- Crystal Reports designer
- Database connections and queries
- Formula editor and functions
- Subreports and cross-tabs
- Publishing to BOBJ BI platform
Module 6: SAP Lumira
- Lumira Designer and Discovery
- Data acquisition and preparation
- Visualization creation
- Story and storyboard design
- Publishing to SAC or BOBJ
Module 7: SAP Analysis for Office
- Analysis for Office overview
- BW and BPC data access
- Workbook design and navigation
- Planning functions integration
- Crosstab analysis and reporting
Module 8: SAP Fiori and Embedded Analytics
- Embedded analytics in S/4HANA
- CDS-based analytical apps
- KPI tiles and overview pages
- Multidimensional reporting
- Smart Business Cockpit
Module 9: Data Visualization Best Practices
- Dashboard design principles
- Choosing the right chart type
- Color, layout, and storytelling
- Mobile-first reporting design
- Accessibility in BI reports
Module 10: BI Administration and Security
- BI platform administration
- Security: Users, groups, access levels
- Content lifecycle management
- Monitoring and auditing
- Backup and recovery
Module 11: SAP BI and SAC Integration
- Migration from BOBJ to SAC
- Live connection to BW and HANA
- Hybrid BI landscape management
- SAC as modern BI frontend
Module 12: Real-Time Projects and Case Studies
- Enterprise BI dashboard development
- Financial and operational reporting
- End-to-end BI implementation
- Certification and interview preparation
Receive Training From Our Skilled and Effective Trainers
Experience in the Industry
Gain knowledge from experts with hands-on SAP BI (Business Intelligence) project experience in enterprise reporting, business intelligence, data warehousing, analytics, and dashboard development across manufacturing, banking, retail, healthcare, telecommunications, and other enterprise industries.
Backgrounds at the Top
Our SAP BI trainers have worked with leading organizations such as HCL, TCS, Accenture, Capgemini, Infosys, Cognizant, and global SAP consulting partners, delivering enterprise reporting, analytics, and business intelligence solutions using SAP technologies.
Clear & Effective Teaching
Complex SAP BI concepts—including data extraction, ETL processes, InfoProviders, data modeling, SAP BusinessObjects, reporting, dashboard development, query design, analytics, and business intelligence workflows—are explained through real-world business scenarios, live demonstrations, and practical implementation examples.
Hands-On Learning Focus
Students gain practical experience by working on live SAP BI environments, building enterprise reports, designing dashboards, creating data models, developing ETL workflows, and implementing real-world business intelligence projects through structured hands-on lab sessions.
Up-to-Date Knowledge
Our trainers continuously update the curriculum with the latest SAP BusinessObjects, SAP Analytics Cloud (SAC), SAP BW/4HANA, SAP S/4HANA Embedded Analytics, AI-powered analytics capabilities, and modern business intelligence best practices to ensure learners develop industry-ready SAP BI skills.
Succeed Our Resourceful Certification
The Certified SAP Business Intelligence (BI) Professional certification validates expertise in data warehousing, reporting, analytics, dashboard development, and business intelligence solutions using SAP technologies. It demonstrates the ability to transform business data into meaningful insights that support strategic decision-making. This certification enhances career opportunities in analytics, reporting, data management, and enterprise intelligence consulting.
Course FAQs
1. What is SAP BI (Business Intelligence)?
SAP BI is a collection of technologies used to integrate, organize, analyze, and report business data. It helps organizations convert data from multiple sources into meaningful reports, dashboards, and business insights.
2. What are the main components of SAP BI?
The SAP BI landscape can include SAP BW, SAP BusinessObjects, Web Intelligence, Crystal Reports, SAP Lumira, SAP Analysis for Office, SAP Analytics Cloud, and SAP S/4HANA Embedded Analytics. These components support data warehousing, reporting, visualization, and analytical decision-making.
3. What is SAP BW?
SAP Business Warehouse (SAP BW) is a data warehousing solution designed to consolidate and analyze enterprise data. It supports data extraction, transformation, modeling, and reporting across business functions.
4. What is SAP BI architecture?
SAP BI architecture describes how data sources, extraction processes, transformation logic, data storage, and reporting applications work together. A typical architecture includes source systems, data integration layers, analytical models, and reporting tools.
5. What is the difference between SAP BI and SAP BW?
SAP BI is a broad term for business intelligence capabilities, including reporting, analytics, and data visualization. SAP BW is a specific SAP data warehousing platform used to integrate and model data for analytical purposes.
6. What is a data warehouse in SAP BI?
A data warehouse is a centralized environment that stores integrated business data for analysis and reporting. It helps users examine historical trends, compare business performance, and generate consolidated reports.
7. What is ETL in SAP BI?
ETL stands for Extract, Transform, and Load. It involves extracting data from source systems, applying business rules and transformations, and loading the prepared data into a target data warehouse.
8. What is a DataSource in SAP BW?
A DataSource defines the structure and extraction characteristics of data obtained from a source system. It identifies the fields and data required for transferring information into the SAP BW environment.
9. What are InfoObjects in SAP BW?
InfoObjects are reusable metadata objects that represent business elements such as customers, products, dates, quantities, and revenue. They form the foundation for data modeling and reporting in SAP BW.
10. What are InfoProviders in SAP BW?
InfoProviders are objects that supply data for analytical queries and reporting. Depending on the SAP BW version, they can include different data storage, modeling, and virtual data access structures.
11. What is data modeling in SAP BW?
Data modeling organizes business data into structures suitable for reporting and analysis. It involves defining data objects, relationships, measures, dimensions, and data flows to meet reporting requirements.
12. What is a transformation in SAP BW?
A transformation defines how source data is mapped and converted into a target structure. It can include field mapping, data conversion, formulas, routines, and business-rule processing.
13. What is a Data Transfer Process (DTP)?
A Data Transfer Process controls the movement of data between supported SAP BW source and target objects. It defines data transfer settings, filters, execution options, and monitoring behavior.
14. What is SAP BusinessObjects?
SAP BusinessObjects is a business intelligence platform that supports report creation, data analysis, content delivery, and BI administration. It includes tools such as Web Intelligence and Crystal Reports.
15. What is the Central Management Console (CMC)?
The Central Management Console is an administration interface for managing the SAP BusinessObjects BI platform. Administrators can use it to manage users, groups, permissions, servers, scheduling, and BI content.
16. What is Universe Design Tool (UDT)?
Universe Design Tool is used to create and maintain semantic layers that simplify database structures for reporting users. It supports defining database connections, classes, objects, joins, and query-related settings.
17. What is a Universe in SAP BusinessObjects?
A Universe provides a business-friendly layer between a database and reporting tools. It presents technical database structures as understandable business objects, such as customer names, sales amounts, product categories, and dates.
18. What are classes and objects in Universe Design?
Classes group related business objects into logical categories. Objects represent individual business elements that users can select when creating reports and queries.
19. What are joins in Universe Design?
Joins define relationships between database tables used in reporting queries. Correct join configuration is important for retrieving accurate results and avoiding duplicated or missing records.
20. What is cardinality in Universe Design?
Cardinality describes the relationship between records in two tables, such as one-to-one, one-to-many, or many-to-many. Understanding cardinality helps designers configure appropriate joins and improve query accuracy.
21. What are contexts in Universe Design?
Contexts define valid join paths through a Universe when multiple possible paths exist between tables. They help resolve ambiguous query structures and reduce incorrect results caused by inappropriate joins.
22. What are derived tables in SAP BusinessObjects?
Derived tables are database tables represented through SQL queries within a Universe. They can simplify complex data structures, combine information, and prepare specific datasets for reporting.
23. What is aggregate awareness in Universe Design?
Aggregate awareness enables a Universe to use suitable summarized tables when available instead of always querying detailed data. When configured correctly, it can improve performance for reports that do not require transaction-level details.
24. What is SAP Web Intelligence?
SAP Web Intelligence, commonly known as WebI, is a reporting and analysis tool within the SAP BusinessObjects ecosystem. It allows users to create interactive reports, apply filters, perform calculations, and analyze business data.
25. How do you create a query in Web Intelligence?
A Web Intelligence query retrieves information from a supported data source or semantic layer. Users select the required objects, define filters and conditions, execute the query, and use the resulting dataset to build reports.
26. What are query filters and report filters in Web Intelligence?
Query filters restrict the data retrieved from the data source, while report filters control which retrieved records are displayed in a report. Using them appropriately can improve report relevance and, where applicable, query performance.
27. What are variables in Web Intelligence?
Variables are custom calculations or expressions created within a Web Intelligence document. They can be used to calculate business metrics, apply conditional logic, manipulate values, and simplify repeated formulas.
28. What are input controls in Web Intelligence?
Input controls allow report users to interactively filter or analyze displayed information. They can be configured to control dimensions, measures, or other report elements based on the document design.
29. How does scheduling work in SAP BusinessObjects?
Scheduling allows reports and other supported BI objects to run automatically at specified times or intervals. Administrators can configure recurring executions, output formats, destinations, and related processing options.
30. What is SAP Crystal Reports?
SAP Crystal Reports is a reporting application used to create structured, formatted reports from supported data sources. It provides features for formulas, grouping, charts, cross-tabs, subreports, and page-level formatting.
31. What are formulas and parameters in Crystal Reports?
Formulas perform calculations and conditional operations on report data. Parameters allow users to provide input values, such as date ranges or customer identifiers, that influence report selection or presentation.
32. What are subreports in Crystal Reports?
Subreports are reports embedded within a main report. They can display related information from separate queries or datasets and are useful when a single report needs multiple reporting sections.
33. What are cross-tabs in Crystal Reports?
Cross-tabs summarize information using rows, columns, and aggregated values. They help users compare business metrics across categories such as products, regions, departments, or reporting periods.
34. What is SAP Lumira?
SAP Lumira is an SAP business intelligence and visualization technology used for data preparation, exploration, and visual analysis. Its available capabilities depend on the specific Lumira product and deployment.
35. What is data preparation in SAP Lumira?
Data preparation involves cleaning, structuring, transforming, and organizing datasets before visualization. It helps improve data consistency and prepares information for meaningful analysis.
36. What is the difference between SAP Lumira Discovery and Lumira Designer?
Lumira Discovery focuses on data exploration, visualization, and story creation for analytical users. Lumira Designer supports the development of more structured and customized analytical applications, depending on the installed version and environment.
37. What is SAP Analysis for Microsoft Office?
SAP Analysis for Microsoft Office is an analytical add-in that enables users to work with supported SAP data inside Microsoft Excel and PowerPoint. It supports analytical workbooks, multidimensional analysis, and report presentation.
38. How is SAP Analysis for Office used with SAP BW?
SAP Analysis for Office can connect to supported SAP BW data sources for analysis and reporting. Users can explore dimensions and measures, apply filters, navigate data, and build analytical workbooks.
39. What is SAP S/4HANA Embedded Analytics?
SAP S/4HANA Embedded Analytics provides analytical capabilities within the S/4HANA transactional environment. It supports operational reporting, analytical applications, KPIs, and business insights based on supported data models.
40. What are CDS views in SAP S/4HANA analytics?
Core Data Services (CDS) views define reusable semantic data models in supported SAP environments. They can expose business information for operational reporting, analytical applications, and other data access scenarios.
41. What are SAP Fiori analytical applications?
SAP Fiori analytical applications provide role-oriented interfaces for reviewing business metrics and analyzing operational data. Depending on the application, users can view KPIs, filter information, drill into details, and monitor performance.
42. What is SAP Analytics Cloud (SAC)?
SAP Analytics Cloud is a cloud-based solution that combines business intelligence, data visualization, planning, and predictive analytics capabilities. It enables organizations to develop dashboards, stories, and analytical applications using supported data sources.
43. What is the difference between live and import connections in SAP Analytics Cloud?
A live connection accesses data from a supported source system without importing the entire dataset into SAP Analytics Cloud. An import connection loads data into the cloud environment, where it can be modeled and analyzed according to the connection and data management configuration.
44. How does SAP BI support dashboard development?
SAP BI tools support dashboard development through charts, tables, KPIs, filters, and interactive visualizations. Dashboard designers should select appropriate visual elements, use reliable data models, and organize information around business requirements.
45. How is security managed in SAP BusinessObjects?
SAP BusinessObjects security can be configured through users, groups, permissions, and access levels. Appropriate security settings help restrict access to reports, folders, Universes, and platform resources according to assigned responsibilities.
46. What is BI content lifecycle management?
BI content lifecycle management involves moving and maintaining reports, Universes, dashboards, and other BI objects across development, testing, and production environments. Controlled promotion helps maintain consistency and reduce deployment errors.
47. How can SAP BI report performance be improved?
Report performance can be improved by optimizing query filters, joins, data models, calculations, and report design. Developers should also review data volumes, source-system performance, scheduling, and the overall data processing flow.
48. What is SAP BI and SAP Analytics Cloud integration?
SAP BI can work with SAP Analytics Cloud as part of a modern analytics landscape. The Edubrights curriculum covers migration from BusinessObjects to SAC, live connections to BW and HANA, and hybrid BI landscape management.
49. What practical projects are covered in SAP BI training in Chennai?
The course page lists projects including a Sales Performance Analytics Dashboard, Financial Reporting and Analysis System, Supply Chain Analytics Solution, Human Resources Analytics Dashboard, and Enterprise Data Warehouse Implementation. These projects cover dashboards, reporting, analytics, data integration, and enterprise data warehousing.
50. What technical skills can I gain from SAP BI training in Chennai?
You can develop skills in SAP BI architecture, data warehousing, ETL, InfoObjects, InfoProviders, BW modeling, query design, BusinessObjects, Universe Design, Web Intelligence, Crystal Reports, Lumira, Analysis for Office, Fiori Embedded Analytics, dashboard development, BI security, and SAP Analytics Cloud integration. These areas are directly aligned with the technical curriculum published on the Edubrights SAP BI course page.
Get Training Quote for Free
Testimonials
Hear What our Students say
"Transform your life through Education, hear it from our Alumni"

6 LPA
Fathima
Student
Software Engineer
"Transform your life through Education, hear it from our Alumni"

8 LPA
Rahul
Student
Data Scientist
"Transform your life through Education, hear it from our Alumni"

8 LPA
Siddharth
NIELSON IQ
Data Analyst