Course Objectives
1. Master SAP Analytics Cloud Fundamentals
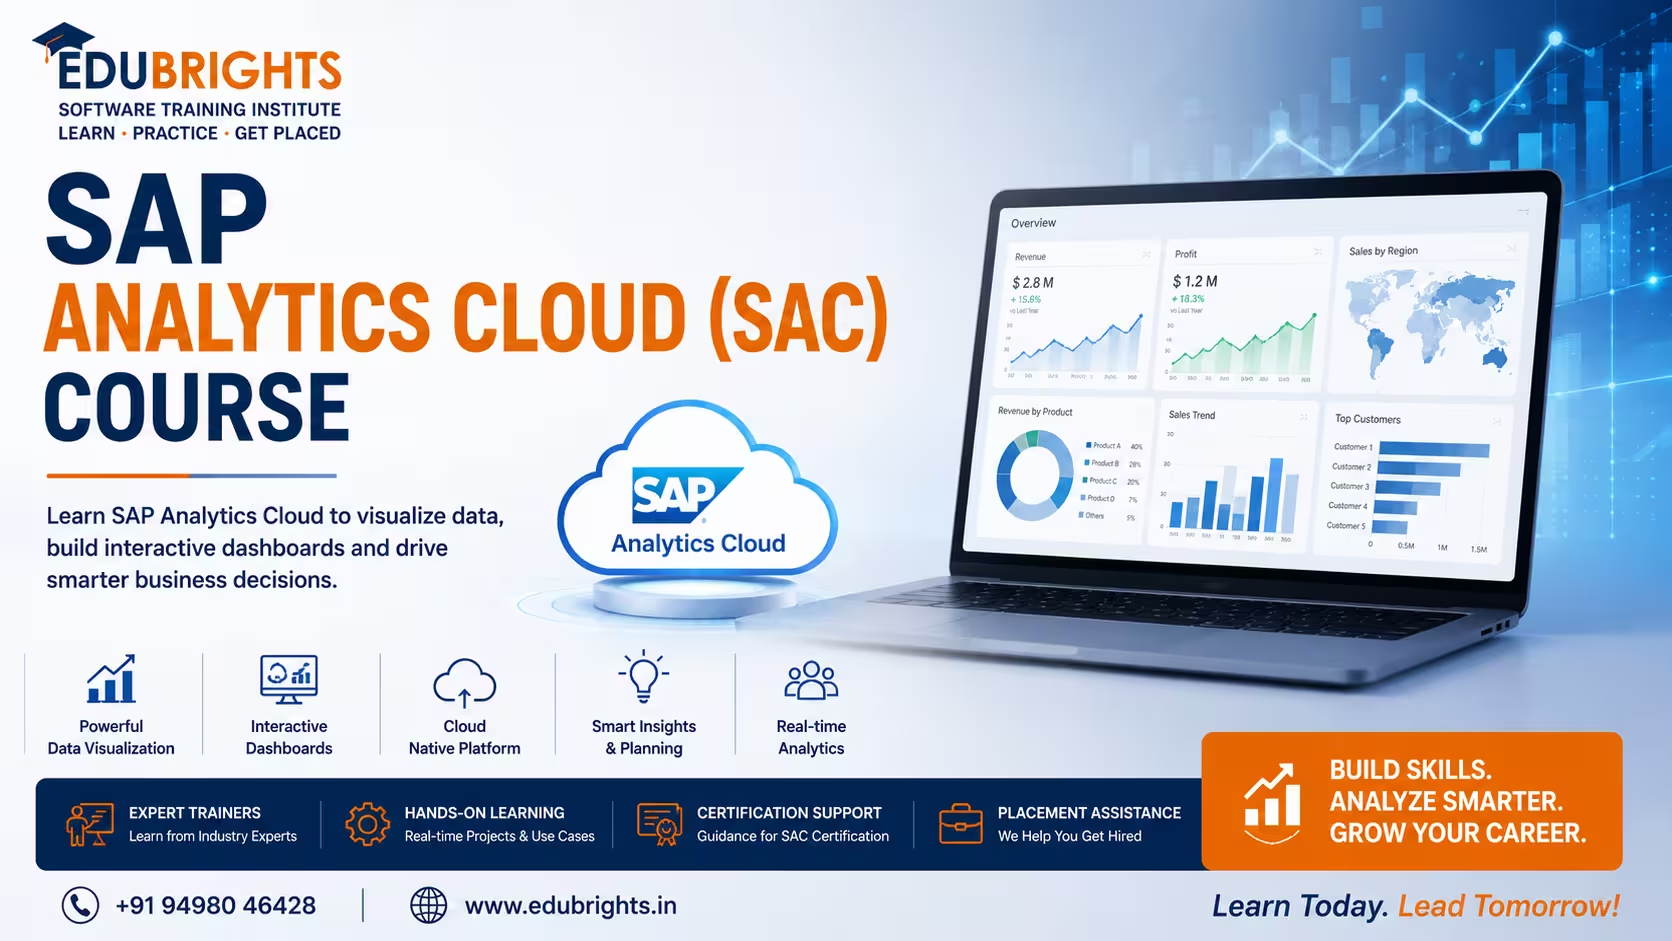
Learn the core concepts of SAP Analytics Cloud (SAC), including business intelligence, planning, predictive analytics, and data visualization.
2. Build Interactive Dashboards and Reports
Develop expertise in creating real-time dashboards, stories, visualizations, and executive reports for business decision-making.
3. Integrate and Analyze Enterprise Data
Gain hands-on experience connecting SAP and non-SAP data sources, modeling datasets, and performing advanced analytics.
4. Prepare for Real-World Analytics Projects
Acquire practical skills required for SAP Analytics Cloud implementation, reporting, planning, forecasting, and analytics consulting roles.
Popular Techniques Covered in This Course
SAP Analytics Cloud Navigation
Data Modeling and Data Preparation
Story Creation and Dashboard Design
Analytics Performance Optimization
Data Connectivity and Live Connections
SAP HANA Integration
Data Visualization Techniques
Planning and Budgeting Models
Predictive Analytics
Business Intelligence Reporting
Get Hands-on Knowledge about Real-Time Projects
Project 1
Project 1: Executive Business Dashboard
Create an executive-level dashboard displaying KPIs, revenue trends, operational metrics, and business performance insights.
Project 2
Project 2: Sales Performance Analytics Solution
Develop interactive sales dashboards to analyze customer behavior, regional sales, profitability, and forecasting metrics.
Project 3
Project 3: Financial Planning and Budgeting Model
Implement planning models for budgeting, forecasting, variance analysis, and financial performance tracking.
Project 4
Project 4: HR Workforce Analytics Dashboard
Design HR analytics solutions for employee performance, workforce planning, recruitment tracking, and attrition analysis.
Project 5
Project 5: SAP Analytics Cloud Integration Project
Connect SAC with SAP S/4HANA, SAP BW, and external data sources to create unified enterprise reporting solutions.
Key Features
Edubrights offers SAP Analytics Cloud (SAC) in virtual mode with expert trainers. Here are the key features,
40 Hours Course Duration
100% Job Oriented Training
Industry Expert Faculties
Free Demo Class Available
Completed 500+ Batches
Certification Guidance
Curriculum
Module 1: Introduction to SAP Analytics Cloud
- Overview of SAP Analytics Cloud
- SAC capabilities: BI, Planning, Predictive
- SAC architecture and tenant management
- SAC licensing and editions
- Integration with SAP and non-SAP sources
Module 2: SAC Data Connectivity
- Live connections: S/4HANA, BW, HANA
- Import connections: CSV, Excel, databases
- OData service connections
- SAP Datasphere integration
- REST API data connections
Module 3: Data Modeling in SAC
- Analytic models and planning models
- Dimensions and measures
- Calculated measures and restricted measures
- Hierarchy setup in models
- Data actions and multi-actions
Module 4: Story Design
- Page layout types: Canvas, responsive, grid
- Charts and visualization objects
- Tables and cross-tab design
- Filters and input controls
- Linked analysis and drill-through
Module 5: Advanced Analytics and Visualization
- Geo maps and location intelligence
- Smart Insights and Smart Discovery
- Variance charts and waterfall charts
- R and Python integration
- Custom widget development
Module 6: SAC Planning
- Planning model configuration
- Budget input forms and tables
- Allocation steps and distribution
- Data locking and versioning
- Workflow for planning approvals
Module 7: Predictive Analytics
- Predictive scenarios: Time series, classification, regression
- Smart Predict configuration
- Predictive model training and evaluation
- Predictive output integration in stories
- Automated machine learning (AutoML)
Module 8: SAC Administration
- User and team management
- Connection and system administration
- Data privacy and masking
- Content lifecycle and transport
- Audit log and monitoring
Module 9: Mobile and Collaboration
- SAC mobile app configuration
- Offline access and favorites
- Commenting and annotation
- Story sharing and embedding
- SAC integration with Microsoft Teams
Module 10: SAC Embedded Analytics
- Embedding SAC stories in Fiori
- SAC embedded in S/4HANA
- URL API and SDK
- Custom applications with SAC
Module 11: SAC Security and Governance
- Role-based access in SAC
- Data access control at row level
- Privacy and GDPR compliance
- Story version management
- Content certification
Module 12: Real-Time Projects and Case Studies
- Enterprise BI and planning dashboard
- Financial consolidation reporting in SAC
- End-to-end SAC implementation
- Certification and interview preparation
Receive Training From Our Skilled and Effective Trainers
Learn from Experienced SAP Analytics Cloud (SAC) Consultants
Gain practical expertise from SAP Analytics Cloud consultants who have successfully delivered enterprise Business Intelligence (BI), Planning, Budgeting, Forecasting, Predictive Analytics, Dashboard Development, Financial Planning, and SAP Digital Transformation projects across global organizations. Learn implementation techniques, best practices, and real-world business scenarios used by leading enterprises.
Industry Exposure with Enterprise SAP Analytics Implementations
Our trainers bring extensive experience from SAP Analytics Cloud implementations across manufacturing, retail, banking, healthcare, logistics, telecommunications, automotive, energy, and professional services. Learn how organizations leverage SAP SAC for executive dashboards, KPI reporting, financial planning, workforce planning, sales analytics, operational reporting, and enterprise decision-making.
Simple, Practical & Business-Oriented Teaching Methodology
Complex SAP Analytics Cloud concepts are explained through step-by-step demonstrations, interactive business scenarios, real-world datasets, dashboard development exercises, planning models, predictive analytics use cases, and hands-on implementation sessions. Our structured approach enables both beginners and experienced professionals to confidently master SAP SAC.
Hands-On Real-Time SAP Analytics Cloud Projects
Develop practical expertise through enterprise-grade projects covering SAP Analytics Cloud administration, live data connections, data modeling, stories, interactive dashboards, KPI reporting, planning models, budgeting, forecasting, predictive analytics, Smart Insights, Smart Discovery, Digital Boardroom, SAP Datasphere integration, SAP S/4HANA analytics, cloud reporting, and executive business intelligence solutions.
Updated with the Latest SAP Analytics Cloud Innovations & AI Capabilities
Our curriculum is continuously updated with the latest SAP Analytics Cloud releases, Joule AI capabilities, AI-powered business analytics, machine learning features, predictive planning, SAP Datasphere integration, SAP Business Data Cloud, SAP S/4HANA Embedded Analytics, cloud planning innovations, enterprise reporting standards, and industry best practices. This ensures learners develop highly relevant, enterprise-ready, and job-oriented SAP Analytics Cloud skills demanded by today's global organizations.
You will succeed with our recognized certification
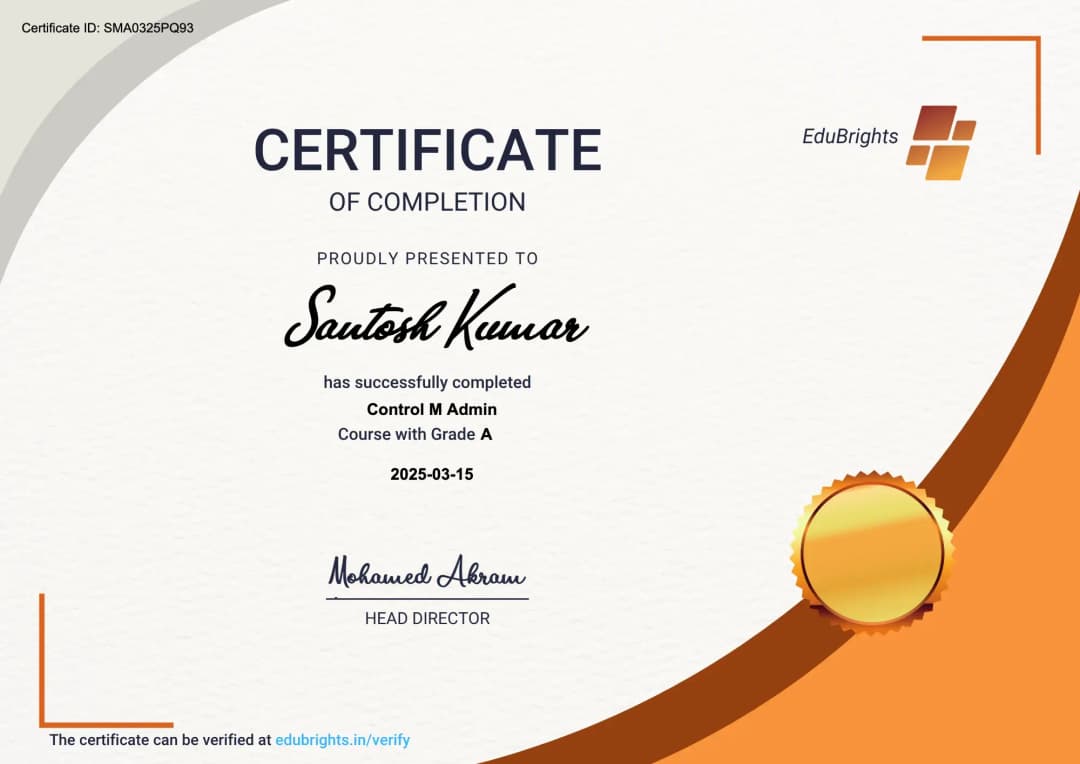
This certification validates your expertise in SAP Analytics Cloud, including dashboard creation, business intelligence reporting, planning models, predictive analytics, data visualization, and enterprise data integration. The certification demonstrates your ability to design and implement analytics solutions that support strategic business decision-making. It prepares learners for professional roles in SAP analytics, reporting, and business intelligence consulting.
Course FAQs
1. What is SAP Analytics Cloud (SAC)?
SAP Analytics Cloud (SAC) is a cloud-based analytics platform that combines business intelligence, augmented analytics, predictive analytics, and enterprise planning. It allows organizations to analyze data, create visualizations, build plans, and generate business insights in one environment.
2. What are the main capabilities of SAP Analytics Cloud?
The major SAC capabilities include business intelligence, data visualization, data modeling, enterprise planning, predictive analytics, reporting, collaboration, and administration. These capabilities support both analytical and planning use cases.
3. What is SAP Analytics Cloud used for?
SAC can be used to create dashboards, interactive stories, analytical reports, planning models, forecasts, KPI reports, and predictive scenarios. It can work with SAP and supported non-SAP data sources for enterprise analytics.
4. What is a story in SAP Analytics Cloud?
A story is an analytical document that can contain charts, tables, visualizations, filters, text, and other objects. Stories are used to present and analyze business data interactively.
5. What are dimensions and measures in SAC?
Dimensions represent descriptive business information such as customer, product, region, or time. Measures represent numerical values such as revenue, cost, quantity, and profit that can be analyzed using dimensions.
6. What is data modeling in SAP Analytics Cloud?
Data modeling defines how business data is structured for analytics or planning. A model can contain dimensions, measures, hierarchies, calculations, attributes, and other components required for analytical processing.
7. What are calculated measures in SAC?
Calculated measures are metrics created using formulas based on existing measures or data elements. They can be used for calculations such as profit margins, percentages, growth rates, and variances.
8. What are restricted measures in SAP Analytics Cloud?
Restricted measures are measures filtered to specific dimension members or conditions. For example, a restricted measure can represent sales for a particular region, product category, or reporting period.
9. What are hierarchies in SAC?
Hierarchies organize dimension members into logical levels. They allow users to analyze data from summarized levels down to more detailed business information.
10. What is the difference between live and import connections in SAC?
A live connection provides access to data directly from the source system, while an import connection brings supported data into SAC. The appropriate approach depends on data architecture, security, performance, and business requirements.
11. What is a live data connection in SAP Analytics Cloud?
A live connection allows SAC to work with data directly from a supported source system without replicating the underlying data into SAC. This can be useful when organizations require access to current source-system data or have data-security requirements.
12. What is an import connection in SAP Analytics Cloud?
An import connection transfers supported source data into SAC. The imported data can then be used for models, stories, dashboards, analysis, and other supported SAC scenarios.
13. Can SAC connect to SAP S/4HANA?
Yes. SAP Analytics Cloud supports integration scenarios with SAP S/4HANA for analytics and planning. Supported connection approaches can allow SAC to consume or exchange business data with S/4HANA.
14. How does SAP HANA integrate with SAP Analytics Cloud?
SAP HANA can provide data to SAC through supported connectivity options. HANA-based data can be used for analytical models, stories, dashboards, and business reporting.
15. How does SAP BW integrate with SAC?
SAP BW and BW/4HANA can provide governed enterprise data for SAC analytics. SAC can use supported connections to build reporting and visualization solutions on top of SAP data.
16. What is SAP Datasphere integration with SAC?
SAP Datasphere can act as a governed data foundation for analytical scenarios. SAC can consume modeled data from Datasphere to create stories, dashboards, reports, and other analytical content.
17. What are OData connections in SAP Analytics Cloud?
OData connections allow SAC to consume data exposed through supported OData services. They can be used for integration with compatible SAP and external applications.
18. What is REST API connectivity in SAC?
REST API connectivity can be used in supported integration scenarios to exchange or access data through web-based services. Authentication and connection configuration depend on the specific service and SAC integration method.
19. What are analytic models in SAP Analytics Cloud?
Analytic models provide a structured foundation for analyzing business data. They can contain dimensions, measures, calculations, and other data structures required for reporting and analysis.
20. What is a planning model in SAC?
A planning model is designed for business planning activities such as budgeting, forecasting, and scenario planning. Planning models provide planning-specific capabilities such as versions, data entry, auditing, and security.
21. What is SAP Analytics Cloud Planning?
SAC Planning provides functionality for creating, maintaining, analyzing, and sharing business plans. It supports activities such as budgeting, forecasting, version management, data entry, and other planning processes.
22. What is version management in SAC Planning?
Version management allows users to work with different versions of planning data. Common planning scenarios include actual, budget, forecast, and simulation versions.
23. What is data locking in SAC Planning?
Data locking restricts changes to selected planning data according to defined rules. It can help protect finalized or approved planning values from unintended modifications.
24. What are data actions in SAP Analytics Cloud?
Data actions are structured operations that can automate data-processing activities in planning models. They can support calculations, copying data, allocations, and other planning operations.
25. What are multi-actions in SAC?
Multi-actions combine multiple supported planning or data-processing operations into a single sequence. They can help automate complex planning workflows and reduce repetitive manual activities.
26. What are allocations in SAC Planning?
Allocations distribute values across selected planning dimensions based on defined rules. They can be used for distributing costs, budgets, revenue, or other planning values.
27. What is forecasting in SAP Analytics Cloud?
Forecasting uses historical and business data to estimate future values or trends. SAC can support forecasting scenarios for areas such as sales, finance, demand, and operational planning.
28. What is predictive analytics in SAC?
Predictive analytics uses statistical and machine-learning capabilities to identify patterns and generate predictions from historical data. SAC provides predictive capabilities for supported analytical and planning scenarios.
29. What is predictive planning in SAP Analytics Cloud?
Predictive planning combines predictive forecasting capabilities with planning processes. It can help organizations incorporate forecast information into planning and decision-making workflows.
30. What is Smart Insight in SAC?
Smart Insight helps users investigate the factors contributing to a selected data point or variance. It provides additional analytical context to help users understand underlying data relationships.
31. What is Smart Discovery in SAP Analytics Cloud?
Smart Discovery uses automated analytical techniques to explore data and identify patterns, relationships, and potential insights. It helps users investigate business information without manually building every analytical view.
32. What are filters and input controls in SAC?
Filters restrict the data displayed in an analytical view according to selected conditions. Input controls allow users to interactively select dimension members or values that influence the displayed analysis.
33. What is linked analysis in SAC?
Linked analysis allows selections made in one visualization to affect other related visualizations. It is useful for interactive dashboard analysis where multiple charts need to respond to user selections.
34. How are charts and tables used in SAC stories?
Charts provide graphical representations of business data, while tables provide detailed multidimensional views. Together, they can be used to build interactive dashboards and analytical reports.
35. Can custom charts be used in SAC stories?
Yes. SAC stories can support additional custom chart types when they are available or installed for the relevant tenant. Custom charts can provide additional visualization options beyond standard chart types.
36. What are geo maps in SAP Analytics Cloud?
Geo maps display business information based on geographical locations. They can be used to analyze metrics such as sales, customers, operations, or performance across regions and territories.
37. What is an analytic application in SAC?
An analytic application is an interactive analytical solution containing components such as charts, tables, filters, and other interface elements. It can provide customized interactions for specific analytical use cases.
38. What is Analytics Designer in SAP Analytics Cloud?
Analytics Designer provides development capabilities for building customized analytical applications. It can be used when organizations require more controlled interactions and application-specific analytical workflows.
39. What is SAC tenant management?
A SAC tenant is an environment in which the organization's SAC content, users, models, connections, and configurations are maintained. Tenant administration involves managing system settings, access, content, and integrations.
40. How does security work in SAP Analytics Cloud?
SAC security uses roles, permissions, teams, data-access controls, and related security mechanisms to control what users can access and perform. Access can be configured according to organizational and business requirements.
41. What is row-level security in SAC?
Row-level or data-level security restricts access to particular records or dimension members based on configured access rules. It allows different users or groups to work with only the business data they are authorized to view.
42. What is Single Sign-On (SSO) in SAC?
Single Sign-On allows users to authenticate through a supported identity provider rather than maintaining separate credentials for each application. SAC supports supported identity and authentication configurations for enterprise environments.
43. How can SAC integrate with SAP S/4HANA planning scenarios?
SAC can be integrated with supported SAP S/4HANA scenarios for analytics and planning. Depending on the architecture, supported OData and other connectivity mechanisms can be used to exchange or consume relevant business data.
44. How can SAC support executive dashboards?
SAC can combine KPIs, charts, tables, filters, and other visualizations into interactive analytical content. This allows organizations to present business performance information through dashboards designed around specific management and reporting requirements.
45. What is enterprise reporting in SAP Analytics Cloud?
Enterprise reporting involves delivering standardized business information across departments and organizational functions. SAC can be used to build reporting solutions for areas such as finance, sales, HR, operations, and management.
46. Can SAC be used for financial planning and budgeting?
Yes. SAC planning capabilities can support budgeting, forecasting, scenario analysis, and financial planning processes. Planning models provide features designed specifically for business planning activities.
47. How can SAC be used for sales analytics?
SAC can combine sales measures and dimensions into interactive dashboards and analytical stories. Sales teams can analyze metrics such as revenue, volume, regional performance, customer trends, and forecasts based on the available data model.
48. How can SAC be used for workforce analytics?
SAC can be used to analyze workforce-related metrics through dashboards, stories, planning models, and analytical content. Depending on the available data, organizations can analyze workforce trends, staffing metrics, performance indicators, and planning scenarios.
49. What technical skills are required to learn SAP Analytics Cloud?
Basic knowledge of business intelligence, data analysis, databases, and reporting is useful for learning SAC. Advanced technical work can benefit from knowledge of data modeling, SQL, APIs, SAP HANA, SAP S/4HANA, SAP BW, and SAP Datasphere.
50. What skills can I gain from SAP Analytics Cloud training in Chennai?
You can develop skills in SAC navigation, data connectivity, live and import connections, data modeling, story development, dashboard design, visualization, planning, budgeting, forecasting, predictive analytics, SAP integration, security, and enterprise reporting. The Chennai course page also includes practical work involving executive dashboards, sales analytics, financial planning, workforce analytics, and SAP integration projects.
Get Training Quote for Free
Testimonials
Hear What Our Students Say
"Transform your life through Education, hear it from our Alumni"

6 LPA
Fathima
Student
Software Engineer
"Transform your life through Education, hear it from our Alumni"

8 LPA
Rahul
Student
Data Scientist
"Transform your life through Education, hear it from our Alumni"
8 LPA
Siddharth
NIELSON IQ
Data Analyst