Course Objectives
1. Why should I learn Qlik Sense & QlikView?
Qlik tools are widely used in companies for data visualization and business reporting. Learning them helps you build strong BI and analytics skills for industry roles.
2. What will I learn in this course?
You will learn data visualization, dashboard creation, data modeling, scripting, and interactive analytics using Qlik Sense and QlikView.
3. How does this course help my career?
The course helps you develop skills required for BI Developer, Data Analyst, and Reporting Analyst roles in analytics-driven companies.
4. Will I work on real-time dashboards?
Yes. You will build interactive dashboards using real datasets and business scenarios to gain practical experience.
Popular Techniques Covered in This Course
Qlik Sense Dashboard Development
QlikView Reporting
Data Visualization Techniques
Data Modeling Basics
ETL Concepts for BI
Set Analysis
Data Filtering & Expressions
Script Editor Usage
KPI Dashboard Creation
Business Data Analysis
Get Hands-on Knowledge about Real-Time Projects
Project 1
1. Sales Performance Dashboard
Build interactive dashboards to analyze sales revenue, product trends, and regional performance.
Project 2
2. Customer Analytics Dashboard
Create reports to study customer behavior, segmentation, and purchase patterns.
Project 3
3. Financial KPI Monitoring System
Develop dashboards for tracking revenue, expenses, and profit metrics.
Project 4
4. Inventory Management Dashboard
Design a BI solution to monitor stock levels, supply chain, and inventory movement.
Project 5
5. HR Analytics Dashboard
Build dashboards to analyze employee performance, attrition, and workforce trends.
Key Features
Edubrights offers Qlik Sense & QlikView Training in virtual mode with expert trainers. Here are the key features,
40 Hours Course Duration
100% Job Oriented Training
Industry Expert Faculties
Free Demo Class Available
Completed 500+ Batches
Certification Guidance
Curriculum
Module 1: Qlik Platform Overview
- Qlik Associative Engine: how it differs from SQL-based BI
- QlikView vs Qlik Sense: product evolution and use cases
- Qlik Sense SaaS vs Qlik Sense Enterprise on Windows
- Qlik Sense interface: hub, app, and sheet navigation
- QlikView Developer: document and object structure
- Qlik certification pathway
Module 2: Data Loading with Qlik Script
- Load Editor: Qlik's ETL and data loading environment
- LOAD statement: loading from files and inline data
- SELECT statement: loading from databases via ODBC/OLE DB
- Resident Load: loading from already-loaded tables
- Preceding Load: chaining transformations
- Script debugging: data preview and load log
Module 3: Data Modelling in Qlik
- Star schema vs snowflake in Qlik: best practices
- Key fields: linking tables in the Qlik data model
- Concatenation: combining tables with matching fields
- Joins in Qlik Script: LEFT JOIN, INNER JOIN, OUTER JOIN
- Synthetic key problem: detection and resolution
- Circular reference handling in Qlik data models
Module 4: Expressions & Set Analysis
- Qlik expression syntax: aggregation functions
- Basic expressions: Sum, Count, Avg, Min, Max
- IF expressions: conditional logic in Qlik
- Set Analysis: calculating in custom selection states
- Set modifiers: field selectors and operators
- Bookmarks in Set Analysis: named selection states
Module 5: Qlik Sense Visualisations
- Charts: bar, line, pie, scatter, combo, map, treemap
- Table and pivot table visualisation
- KPI object: single metric display
- Filter pane: multi-field selection UI
- Gauge: target vs actual display
- Sheet design: layout grid and responsive sizing
Module 6: Advanced Expressions & Variables
- Variables in Qlik: definition and usage
- Dollar-sign expansion: dynamic script and expressions
- Class function: custom bucketing
- Rank and aggr: nested aggregation
- Inter-record functions: Above, Below, Peek, Previous
- Text and number formatting functions
Module 7: QlikView Dashboard Development
- QlikView document: sheet, chart, and list box objects
- QlikView chart wizard: fast chart creation
- Document properties: security and performance
- Macro editor: VBScript automation in QlikView
- Section Access: row-level data security in QlikView
- Container object: multi-chart tabbed display
Module 8: Deployment, Security & Management
- Qlik Sense Management Console: apps and spaces
- Data spaces: shared, managed, and personal
- Section Access in Qlik Sense: dynamic data reduction
- Qlik Cloud tenant administration
- Scheduled reloads and automation tasks
- Qlik Sense embedding and mashup development
Receive Training From Our Skilled and Effective Trainers
Our Qlik instructors are Qlik-certified BI developers and Qlik Analytics Platform specialists who have built enterprise Qlik Sense and QlikView applications for manufacturing, retail, and financial services. They bring deep Associative Engine knowledge, advanced set analysis expertise, and data modelling skills essential for high-performance Qlik applications.
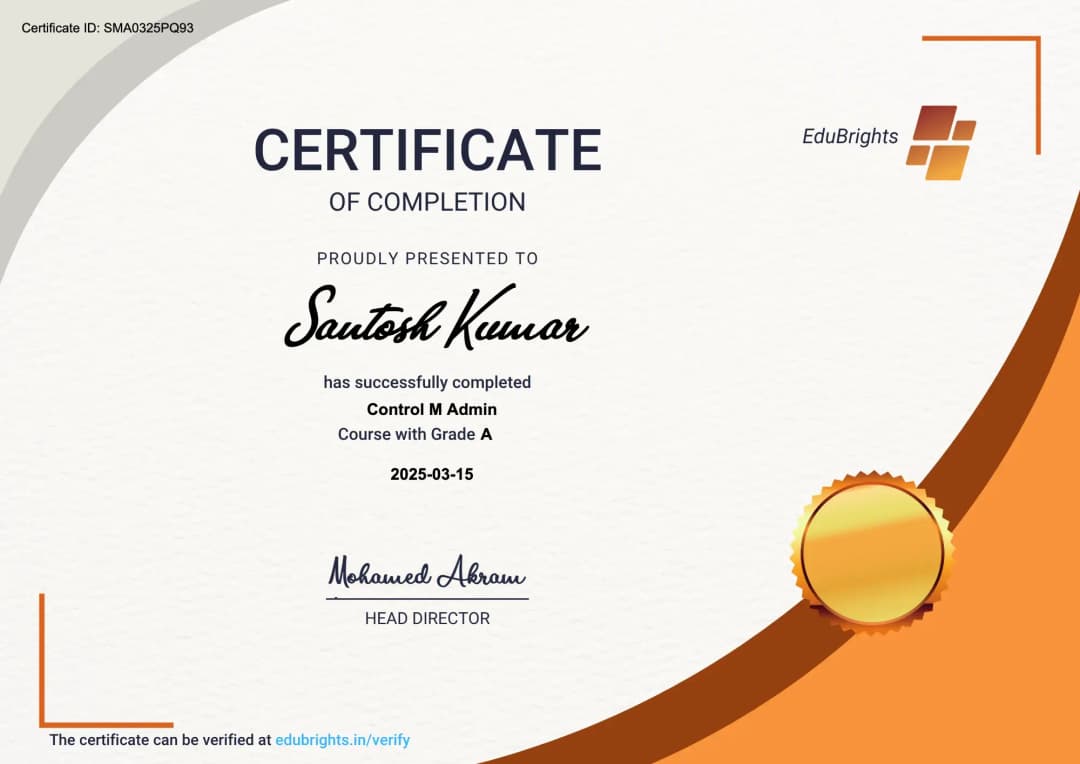
About Our Course Certification*
Our institution offers a recognized Qlik Sense & QlikView certification that validates your ability to design and prototype professional user interfaces efficiently. This certification enhances your design portfolio and prepares you for collaborative projects in real-world environments. Gain practical skills through hands-on training and assessments.
Course FAQs
1. What is Qlik Sense?
Qlik Sense is a modern self-service BI tool used for creating interactive dashboards and visual analytics.
2. What is QlikView?
QlikView is an older but widely used BI tool for guided analytics and enterprise reporting.
3. What is the difference between Qlik Sense and QlikView?
Qlik Sense is more user-friendly and modern, while QlikView is script-driven and used for traditional BI reporting.
4. Who should learn Qlik tools?
Data analysts, BI developers, reporting professionals, and freshers interested in analytics careers
5. Is coding required?
Basic scripting knowledge helps, but most tasks are done using drag-and-drop visualization.
6. Is this course suitable for beginners?
Yes. It starts from basic concepts and moves to advanced dashboard development.
7. What industries use Qlik?
Banking, healthcare, retail, telecom, manufacturing, and logistics industries use Qlik for analytics.
8. Will I learn dashboards?
Yes. Dashboard creation is a core part of this training.
9. What is set analysis in Qlik?
Set analysis is a powerful feature used to perform advanced data filtering and calculations.
10. Do I need SQL knowledge?
Basic SQL knowledge is helpful but not mandatory.
11. Will I get hands-on practice?
Yes. You will work on real datasets and business scenarios.
12. Is Qlik in demand?
Yes. Many enterprises use Qlik for BI reporting and analytics solutions.
Get Training Quote for Free
Testimonials
Hear What Our Students Say
"Transform your life through Education, hear it from our Alumni"

6 LPA
Fathima
Student
Software Engineer
"Transform your life through Education, hear it from our Alumni"

8 LPA
Rahul
Student
Data Scientist
"Transform your life through Education, hear it from our Alumni"

8 LPA
Siddharth
NIELSON IQ
Data Analyst
