Course Objectives
1. Why should I learn New Relic Full Stack Observability?
New Relic Full Stack Observability enables organizations to monitor applications, infrastructure, networks, logs, and cloud environments from a single platform. Learning this technology prepares you for careers in DevOps, Site Reliability Engineering (SRE), Cloud Operations, and Application Performance Monitoring (APM).
2. How will this New Relic course improve my monitoring and observability skills?
This course teaches you how to monitor application performance, analyze distributed systems, collect logs and metrics, configure alerts, build dashboards, troubleshoot production issues, and optimize system reliability using New Relic.
3. Is this New Relic Full Stack Observability training suitable for beginners?
Yes. The course begins with observability fundamentals before progressing to Application Performance Monitoring (APM), Infrastructure Monitoring, Distributed Tracing, Log Management, Synthetic Monitoring, Kubernetes monitoring, and automation.
4. What practical knowledge will I gain during this course?
You will configure monitoring agents, collect application metrics, analyze logs, monitor cloud infrastructure, investigate performance bottlenecks, create dashboards, configure alerts, and troubleshoot enterprise applications using real-world scenarios.
5. How does this course help me build a career in DevOps and Cloud Monitoring?
The training focuses on practical implementation, hands-on monitoring projects, production troubleshooting, cloud observability, and performance optimization, preparing you for roles such as DevOps Engineer, SRE Engineer, Cloud Engineer, Monitoring Engineer, and Application Support Engineer.
Popular Techniques Covered in This Course
New Relic Platform Administration
Application Performance Monitoring (APM)
Infrastructure Monitoring
Log Management & Analysis
Distributed Tracing
Dashboard Creation & Visualization
Alert Policies & Incident Management
Kubernetes & Container Monitoring
Cloud Observability
Performance Optimization & Root Cause Analysis
Get Hands-on Knowledge about Real-Time Projects
Project 1
1. Enterprise Application Performance Monitoring Solution
Implement a comprehensive monitoring platform for enterprise applications by configuring APM agents, tracking transactions, monitoring response times, analyzing errors, and optimizing application performance through real-time insights.
Project 2
2. Cloud Infrastructure Observability Dashboard
Develop a centralized observability dashboard that monitors virtual machines, cloud services, containers, databases, and network resources while providing real-time health metrics, alerts, and performance analytics.
Project 3
3. Kubernetes Monitoring & Container Performance Analysis
Build a monitoring solution for Kubernetes clusters that tracks container health, resource utilization, pod performance, service availability, and infrastructure metrics to ensure reliable cloud-native application deployment.
Project 4
4. Distributed Microservices Performance Monitoring
Create an observability platform that uses distributed tracing to monitor microservices communication, identify latency issues, analyze transaction flows, and accelerate root cause analysis across enterprise applications.
Project 5
5. Automated Incident Detection & Root Cause Analysis Platform
Design an intelligent monitoring solution that correlates application metrics, infrastructure events, and log data to detect incidents, trigger automated alerts, identify root causes, and minimize production downtime.
Key Features
Edubrights offersNEW RELIC – FULL STACK OBSERVABILITY Training in virtual mode with expert trainers. Here are the key features,
40 Hours Course Duration
100% Job Oriented Training
Industry Expert Faculties
Free Demo Class Available
Completed 500+ Batches
Certification Guidance
Curriculum
Module 1: Introduction to New Relic
- Overview of New Relic as a unified observability platform
- New Relic architecture: data ingest, NRDB and telemetry pipeline
- New Relic's pricing model: consumption-based and all-in-one
Module 2: New Relic APM
- APM agent deployment: Java, Python, Ruby, .NET and Go
- Service maps and distributed tracing
- Error tracking and exception analysis
Module 3: Infrastructure Monitoring
- Infrastructure agent deployment on Linux and Windows
- Kubernetes cluster monitoring with Pixie
- Cloud integrations: AWS, Azure and GCP
Module 4: Browser & Mobile Monitoring
- Browser agent deployment and SPA monitoring
- Core Web Vitals and Apdex configuration
- Mobile monitoring for iOS and Android
Module 5: Logs Management
- Log ingest: agent forwarding and API ingestion
- Log parsing with Grok patterns
- Connecting logs to traces and metrics
Module 6: NRQL & Custom Dashboards
- New Relic Query Language (NRQL) fundamentals
- Building custom dashboards and charts
- Alerting with NRQL-powered alert conditions
Module 7: New Relic as Code & Administration
- Terraform provider for New Relic configuration as code
- User management and account administration
- New Relic CLI and API-based automation
Receive Training From Our Skilled and Effective Trainers
New Relic Certified Practitioners All instructors are New Relic certified and have implemented observability programmes at DevOps-mature organisations across cloud-native industries.
NRQL & Data Analysis Expertise New Relic's NRDB and NRQL are powerful tools — trainers develop strong NRQL skills so learners can answer any observability question with data.
Kubernetes & Cloud-Native Specialisation With deep Kubernetes monitoring experience using Pixie and the Kubernetes Cluster Explorer, instructors prepare learners for modern cloud-native observability challenges.
OpenTelemetry Standards Instructors bring OpenTelemetry expertise guiding learners on standards-based telemetry collection that works across New Relic and other observability platforms.
New Relic FutureStack Community Trainers attend New Relic FutureStack and participate in the New Relic Community forum to stay current with platform developments.
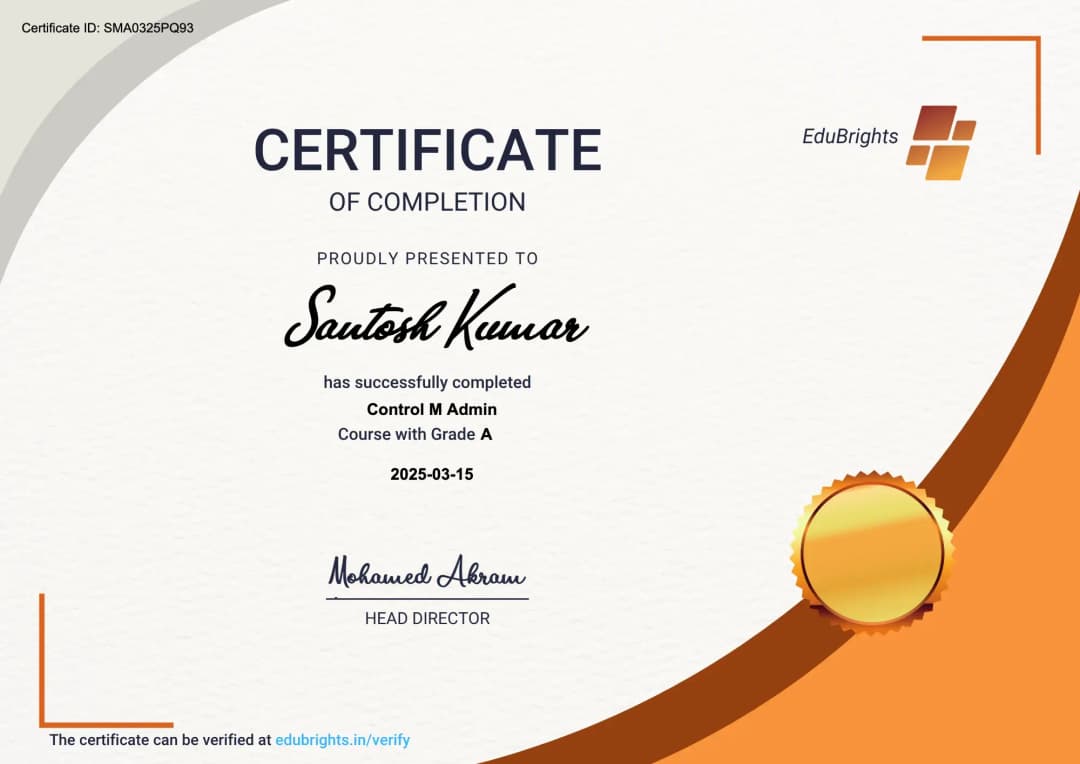
New Relic Full Stack Observability Professional Certification
Successfully completing the New Relic – Full Stack Observability course validates your expertise in monitoring applications, infrastructure, cloud environments, containers, and distributed systems using the New Relic platform.
Course FAQs
1. What is New Relic Full Stack Observability?
New Relic Full Stack Observability is a cloud-based observability platform that provides end-to-end monitoring of applications, infrastructure, logs, networks, cloud services, and user experiences from a unified dashboard.
2. Who can enroll in this New Relic course?
Students, DevOps Engineers, Cloud Engineers, Site Reliability Engineers (SRE), System Administrators, Application Support Engineers, Software Developers, and IT professionals can enroll.
3. Are there any prerequisites?
Basic knowledge of operating systems, networking, cloud computing, or application development is helpful but not mandatory.
4. What topics are covered in this course?
The course covers APM, infrastructure monitoring, distributed tracing, log management, dashboards, alerting, synthetic monitoring, Kubernetes monitoring, cloud integrations, and incident management.
5. Will I learn Application Performance Monitoring (APM)?
Yes. You'll learn to monitor application response times, transactions, errors, throughput, and overall application health using New Relic APM.
6. Does the course include log management?
Yes. You'll collect, search, filter, analyze, and correlate logs with application and infrastructure metrics for faster troubleshooting.
7. Will I learn distributed tracing?
Yes. The course teaches distributed tracing to identify latency issues and analyze requests across microservices and distributed applications.
8. Are dashboards and custom reports included?
Yes. You'll create interactive dashboards, visualizations, and reports to monitor infrastructure health and business performance metrics.
9. Will I learn alert configuration and incident management?
Yes. You'll configure alert policies, notification channels, incident workflows, and automated responses to critical system events.
10. Does the course include Kubernetes and cloud monitoring?
Yes. You'll monitor Kubernetes clusters, cloud infrastructure, containers, and cloud-native applications using New Relic observability tools.
11. Are practical lab sessions included?
Yes. Every module includes hands-on exercises that simulate enterprise monitoring, troubleshooting, and production support scenarios.
12. Is online New Relic training available?
Yes. Both instructor-led online and classroom training options are available with practical lab access.
13. Will I receive placement assistance?
Yes. The course includes resume preparation, mock interviews, technical interview guidance, and placement assistance.
14. What job roles can I apply for after completing this course?
You can apply for DevOps Engineer, Site Reliability Engineer (SRE), Cloud Operations Engineer, Monitoring Engineer, Application Support Engineer, Performance Engineer, and Infrastructure Engineer roles.
15. Why is Full Stack Observability important for modern IT environments?
Modern applications run across cloud, containers, microservices, and distributed systems. Full Stack Observability helps organizations proactively monitor performance, reduce downtime, improve user experience, and quickly resolve production issues.
Get Training Quote for Free
Testimonials
Hear What Our Students Say
"Transform your life through Education, hear it from our Alumni"
8 LPA
Rahul
Student
Data Scientist
"Transform your life through Education, hear it from our Alumni"

6 LPA
Fathima
Student
Software Engineer
"Transform your life through Education, hear it from our Alumni"
8 LPA
Siddharth
NIELSON IQ
Data Analyst