Course Objectives
1. What is the objective of the Looker – Google BI Platform course?
This course is designed to help learners master Google Looker, Google's enterprise Business Intelligence (BI) platform. You will learn data modeling with LookML, build interactive dashboards, create enterprise reports, analyze business data, and deliver data-driven insights for modern organizations.
2. Who should enroll in this Looker – Google BI Platform course?
This course is ideal for students, freshers, data analysts, business analysts, BI developers, data engineers, SQL developers, cloud professionals, digital analysts, and working professionals who want to build a career in Business Intelligence and Analytics.
3. What practical skills will I gain from this training?
You will learn LookML development, data modeling, SQL integration, dashboard creation, report building, Google Cloud integration, BigQuery connectivity, data exploration, embedded analytics, and enterprise BI reporting using real-world business datasets.
4. Does this course include real-time projects?
Yes. The course includes practical labs, enterprise dashboard development, BigQuery integration projects, sales analytics, financial reporting, customer analytics, and real-time BI implementation scenarios.
5. Do I need SQL knowledge?
After completing this course, you can pursue careers as a Looker Developer, Business Intelligence Developer, Data Analyst, BI Consultant, Analytics Engineer, Data Visualization Specialist, SQL Developer, Reporting Analyst, or Google Cloud Data Professional.
Popular Techniques Covered in This Course
Looker Fundamentals
LookML Development
Data Modeling
Dashboard Development
Data Visualization
Business Intelligence Reporting
KPI Creation and Monitoring
BigQuery Integration
Data Governance
Analytics Solution Design
Get Hands-on Knowledge about Real-Time Projects
Project 1
1. Sales Analytics Dashboard
Build an interactive dashboard that tracks sales revenue, product performance, customer trends, and regional business growth.
Project 2
2. Customer Insights Reporting System
Create reports and visualizations to analyze customer behavior, purchasing patterns, and retention metrics.
Project 3
3. Marketing Campaign Performance Dashboard
Develop a dashboard to monitor campaign ROI, lead generation, conversion rates, and marketing effectiveness.
Project 4
4. Financial Analytics and KPI Tracker
Design executive dashboards for revenue analysis, expense monitoring, profitability measurement, and business forecasting.
Project 5
5. Enterprise Business Intelligence Solution
Implement a complete Looker analytics environment by connecting multiple data sources and delivering centralized reporting capabilities.
Key Features
Edubrights offers Looker – Google BI Platform Training in virtual mode with expert trainers. Here are the key features,
40 Hours Course Duration
100% Job Oriented Training
Industry Expert Faculties
Free Demo Class Available
Completed 500+ Batches
Certification Guidance
Curriculum
Module 1: Looker Platform Overview
- Looker architecture: LookML model, Explores, dashboards
- Looker vs Tableau vs Power BI: modern BI comparison
- LookML: the code-based semantic layer concept
- Looker instance setup and project configuration
- Looker IDE: developing LookML in the browser
- Looker certification: Looker Business Analyst and Developer
Module 2: LookML Fundamentals
- Views: defining tables and columns in LookML
- Dimensions: text, number, date, and tier types
- Measures: count, sum, average, and custom aggregates
- Explores: joining views for self-service querying
- LookML project structure: models, views, and explores
- Deploying LookML: Git integration and version control
Module 3: Advanced Dimensions & Measures
- Derived dimensions: case, SQL expression, and type: yesno
- Date dimensions: date, week, month, quarter, year drill paths
- Measure filters: conditional aggregation
- Filtered measures: count distinct with conditions
- Running total measures and cumulative aggregations
- Percentages and ratio measures
Module 4: Explores & Joins
- Join types: LEFT JOIN, INNER JOIN, FULL OUTER JOIN in LookML
- sql_on and foreign_key join definitions
- relationship parameter: one-to-many, many-to-one
- Fanout problem: understanding and avoiding double-counting
- Symmetric aggregates: solving fanout with primary keys
- Always filter: default filter requirements for Explores
Module 5: Derived Tables
- SQL derived tables: custom SQL as a LookML view
- PDTs (Persistent Derived Tables): materialised LookML views
- PDT persistence: datagroup-based and sql_trigger_value
- Native derived tables: LookML-defined SQL
- Incremental PDTs for large dataset efficiency
- Derived table best practices and use cases
Module 6: Parameters, Templated Filters & Liquid
- Parameters: user-selectable inputs to LookML
- Templated filters: dynamic SQL injection from user input
- Liquid templating: conditional LookML logic
- HTML formatting: rich text in Looker table cells
- Links: drill and URL actions from Looker fields
- Dynamic dimensions with Liquid conditionals
Module 7: Looker Dashboards & Visualisations
- Dashboard design: tiles, filters, and layout
- Visualisation types: bar, line, scatter, pie, map, table
- Dashboard filters: linked filters across tiles
- Cross-filtering: click-to-filter dashboard interaction
- Scheduling dashboard deliveries: email and Slack
- Looker Blocks: pre-built analytics templates
Module 8: Administration, Performance & Embedding
- Looker roles and content access management
- Model sets and data access groups for row-level security
- Caching policy configuration and datagroups
- Query performance: SQL Runner and LookML optimisation
- Looker embedding: signed embeds and SSO
- Looker API: programmatic content and data access
Receive Training From Our Skilled and Effective Trainers
Our Looker instructors are LookML developers and analytics engineers who have built Looker semantic layers for data-driven companies, defining governed metrics and dimensions that serve self-service analytics at scale. They bring software engineering discipline to BI — Git-versioned LookML, CI/CD for data models, and deep Explore optimisation knowledge.
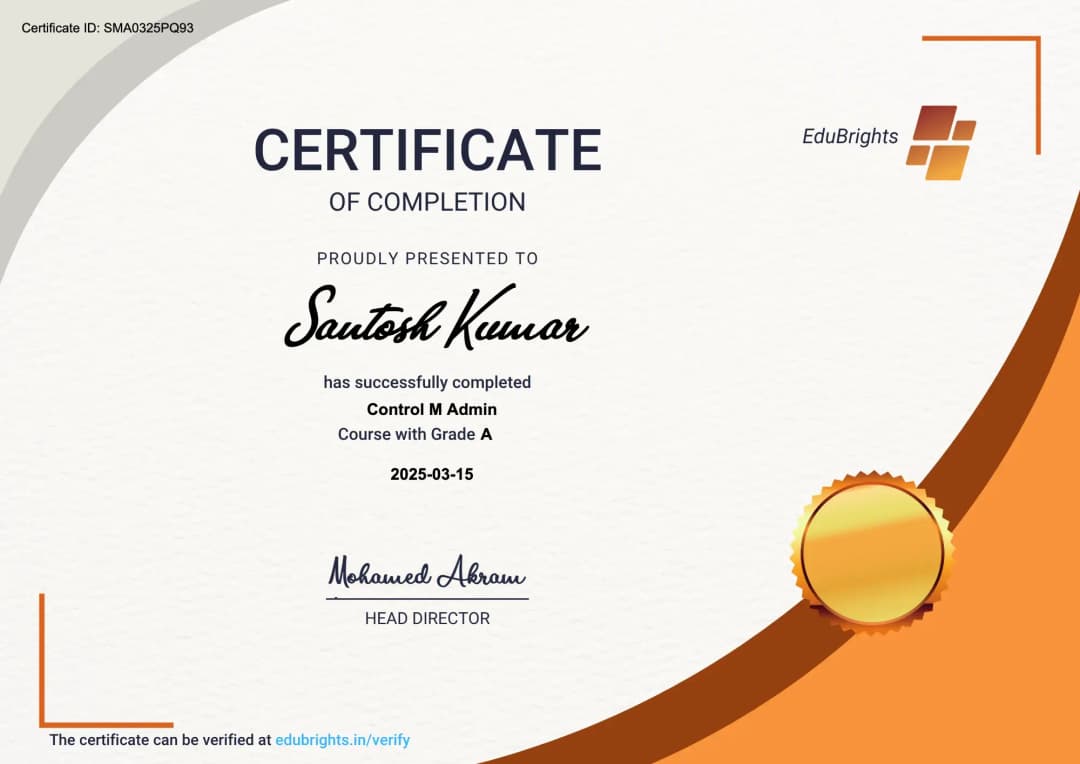
Become a Certified Looker – Google BI Platform Professional
Validate your expertise in Google Looker, LookML, enterprise business intelligence, dashboard development, data modeling, SQL integration, BigQuery connectivity, and interactive analytics.
Course FAQs
1. What is Looker?
Looker is Google's Business Intelligence platform used for data exploration, reporting, dashboards, and analytics
2. Who should learn Looker?
Data Analysts, Business Analysts, BI Developers, Data Engineers, and Analytics Professionals.
3. What is LookML?
LookML is Looker's modeling language used to define business metrics, dimensions, and relationships.
4. Is coding required for Looker?
Basic SQL knowledge is recommended, but advanced programming is not mandatory.
5. Can beginners learn Looker?
Yes. The course starts with fundamentals and gradually moves to advanced topics.
6. What databases can Looker connect to?
Looker supports BigQuery, Snowflake, Oracle, MySQL, PostgreSQL, Redshift, and many other databases.
7. What is the difference between Looker and Looker Studio?
Looker provides enterprise data modeling and governance, while Looker Studio focuses primarily on visualization and reporting.
8. What industries use Looker?
Looker provides enterprise data modeling and governance, while Looker Studio focuses primarily on visualization and reporting.
9. How long does it take to learn Looker?
Most learners can gain practical knowledge within 6–10 weeks.
10. What job roles can I apply for after this course?
Looker Developer, BI Developer, Data Analyst, Business Analyst, and Analytics Consultant.
11. Does Looker support real-time analytics?
Yes. Looker enables real-time access and analysis of data directly from connected databases.
12. What is a dashboard in Looker?
A dashboard is a collection of reports, charts, and KPIs that provide business insights in a single view.
13. Does the course include placement assistance?
Yes. We provide resume building, mock interviews, career guidance, portfolio preparation, and placement support.
14. Are practical projects included?
Yes. Every module includes real-world assignments, case studies, and enterprise dashboard development projects.
15. Why choose this Looker – Google BI Platform course in Chennai?
Our Looker training in Chennai offers industry-oriented curriculum, expert trainers, hands-on labs, live projects, certification guidance, interview preparation, and placement assistance to help you succeed in the Business Intelligence industry.
Get Training Quote for Free
Testimonials
Hear What Our Students Say
"Transform your life through Education, hear it from our Alumni"

8 LPA
Rahul
Student
Data Scientist
"Transform your life through Education, hear it from our Alumni"

6 LPA
Fathima
Student
Software Engineer
"Transform your life through Education, hear it from our Alumni"

8 LPA
Siddharth
NIELSON IQ
Data Analyst
