Popular
Data Analytics Interview Questions
Ahmed
April 11, 2026
15 min read
This blog covers the top 50 Data Analyst interview questions and answers for 2025, designed specifically for freshers and college students. The questions are grouped into five sections — Basic, Intermediate, Advanced, Real-World Scenarios, and Programming (SQL, Python, Excel) — with 10 MCQ-style questions included. Each answer is written in simple, easy-to-understand English with practical explanations. Whether you are preparing for your first data analyst job or brushing up before an interview, this guide helps you walk in confident and ready.
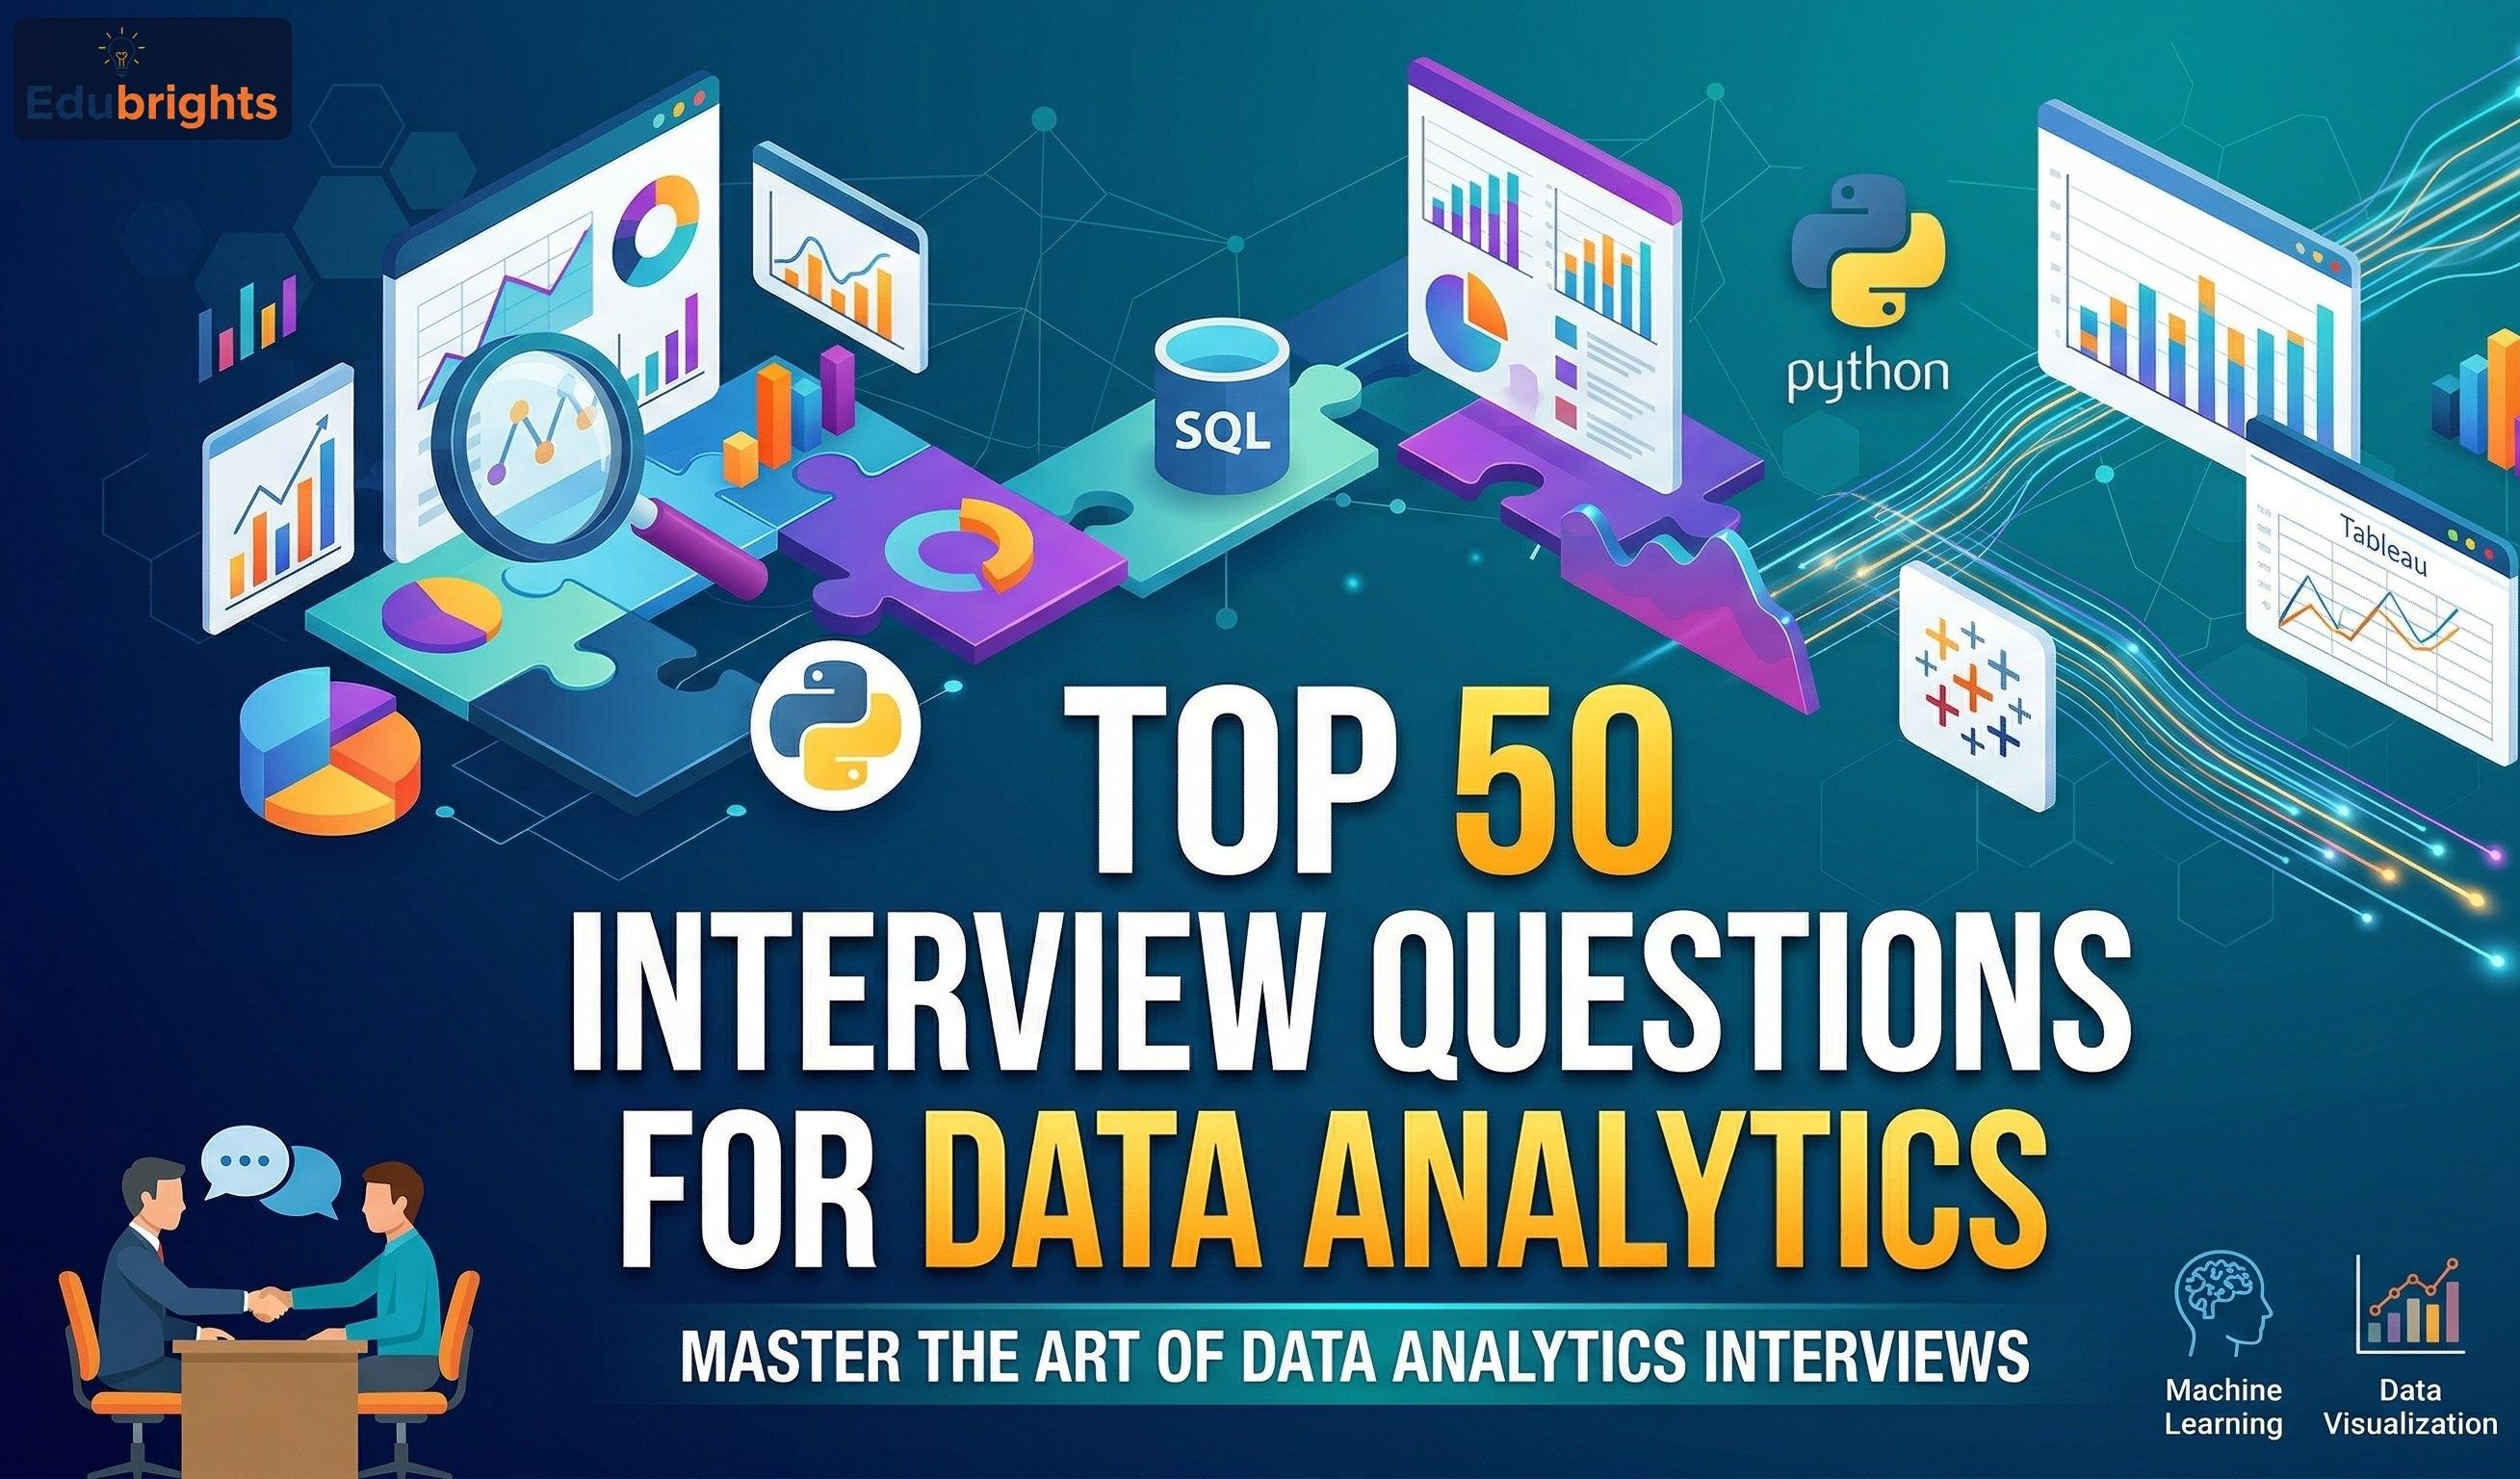
50 Data Analyst Interview Questions and Answers (2025) – Freshers & Experienced
Meta Description: Looking for the best Data Analyst Interview Questions? Here are 50 carefully picked questions with clear answers for freshers and experienced candidates — covering SQL, Python, Excel, and real-world scenarios.
Introduction
So you've got a Data Analyst interview coming up — congratulations! Whether you're a fresh graduate stepping into your first tech interview or someone switching careers into analytics, this guide is built for you.
Data Analyst roles are one of the most in-demand jobs in India and globally right now. Companies across IT, finance, healthcare, and e-commerce are actively hiring analysts who can make sense of data and turn it into useful decisions.
But interviews can feel overwhelming — especially when you're not sure what to expect. That's exactly why we put together this list of 50 Data Analyst Interview Questions and Answers that covers everything from basics to advanced concepts, SQL and Python programming, Excel tricks, and real-world scenario-based questions.
We've written every answer in simple, plain English — no unnecessary jargon, no copy-paste definitions. Just clear, honest explanations that actually help you understand the topic and walk into your interview feeling confident.
Let's get into it.
Section 1: Basic Data Analyst Interview Questions (For Freshers)
These are the most common entry-level questions asked in Data Analyst interviews for freshers. If you're just starting out, make sure you're comfortable with all of these.
Q1. What is Data Analytics, and why does it matter?
Data Analytics is the process of collecting, cleaning, and analyzing data to find useful patterns and insights that help businesses make better decisions.
Think of it like this — a retail store collects sales data every day. Data analytics helps the store figure out which products sell the most, when sales drop, and why. That kind of information helps them stock better, plan promotions, and save money.
It matters because most modern businesses run on data. Companies that use analytics well tend to make smarter decisions faster than those that don't.
Q2. What are the different types of Data Analytics?
There are four main types:
- Descriptive Analytics — Answers "What happened?" (e.g., total sales last month)
- Diagnostic Analytics — Answers "Why did it happen?" (e.g., why did sales drop in June?)
- Predictive Analytics — Answers "What might happen next?" (e.g., expected sales next quarter)
- Prescriptive Analytics — Answers "What should we do about it?" (e.g., increase stock in high-demand regions)
For freshers, descriptive and diagnostic are the most commonly tested in interviews.
Q3. What is the difference between Data Analytics and Data Science?
This is a very common question in Data Analyst interviews for freshers, and people often mix these two up.
Data Analytics focuses on analyzing existing data to find trends and insights. It's more about understanding what's already there.
Data Science goes a step further — it involves building machine learning models, working with unstructured data (like images or text), and predicting future outcomes using algorithms.
Think of a Data Analyst as someone who reads and explains the story in the data. A Data Scientist is more like someone who writes a program to predict the next chapter.
Q4. What is a KPI? Give an example.
KPI stands for Key Performance Indicator. It's a measurable value that shows how well a business or process is achieving its goals.
For example, if a company wants to grow its revenue, a KPI might be "Monthly Revenue Growth Rate." If a customer support team wants to improve service, their KPI might be "Average Ticket Resolution Time."
As a Data Analyst, you'll often be asked to track, report, and visualize KPIs for different teams.
Q5. What is the difference between structured and unstructured data?
Structured data is organized in rows and columns — like a spreadsheet or a database table. It's easy to search and analyze. For example: customer names, order dates, product prices.
Unstructured data has no fixed format. Examples include emails, social media posts, images, audio recordings, and videos. It's harder to analyze and usually requires special tools.
Most of what a Data Analyst works with daily is structured data.
Q6. What tools do Data Analysts typically use?
Some of the most commonly used tools in the industry are:
- Microsoft Excel — For data cleaning, formulas, pivot tables, and basic dashboards
- SQL — For querying databases and extracting data
- Power BI / Tableau — For creating interactive dashboards and reports
- Python / R — For advanced data analysis and automation
- Google Sheets — A simpler, cloud-based alternative to Excel
In most entry-level interviews, expect questions on Excel, SQL, and either Power BI or Tableau.
Q7. What is a null value, and how do you handle it?
A null value means the data is missing or unknown for that particular field. It's different from zero or an empty string — null literally means "no value exists."
How you handle nulls depends on the situation:
- Remove the row if the missing data is critical and can't be estimated
- Replace with mean/median/mode for numerical columns (e.g., fill missing age with the average age)
- Replace with a default value (e.g., "Unknown" for a category field)
- Leave it as-is if the null itself carries meaning (e.g., a null end date might mean the record is still active)
Always understand why a value is missing before deciding how to handle it.
Q8. What is data cleaning, and why is it important?
Data cleaning (also called data wrangling) is the process of finding and fixing errors, inconsistencies, and missing values in a dataset before analysis.
Real-world data is messy. You'll find duplicate records, typos in names, dates in the wrong format, missing values, and numbers stored as text. If you analyze dirty data, your results will be unreliable — and bad analysis leads to bad decisions.
It's often said that a Data Analyst spends around 60–80% of their time cleaning data. It's not the most exciting part of the job, but it's one of the most important.
Q9. What is the difference between a database and a spreadsheet?
A spreadsheet (like Excel or Google Sheets) is great for smaller datasets that one or a few people work with. It's visual, easy to use, and has built-in formulas. But it struggles with very large datasets and isn't designed for multiple users editing at the same time.
A database (like MySQL, PostgreSQL, or SQL Server) is designed to store large amounts of data, support multiple users, and allow fast querying. It's more powerful but requires knowledge of SQL to access the data.
As a Data Analyst, you'll likely use both — databases to pull data, and spreadsheets to present or explore it.
Q10. What is a data pipeline?
A data pipeline is a series of steps that move data from one place to another — usually from a source (like a website or app) through processing stages and finally into a destination (like a database or dashboard).
Imagine water flowing through pipes from a reservoir to your tap. A data pipeline works the same way — data flows, gets cleaned and transformed along the way, and arrives ready to use.
Data Analysts don't usually build pipelines themselves (that's more of a Data Engineer's job), but understanding how they work is very useful.
Section 2: Intermediate Data Analyst Interview Questions
These questions go a level deeper. If you've done a course or internship in data analytics, you should be comfortable answering these.
Q11. What is the difference between OLAP and OLTP?
OLTP (Online Transaction Processing) systems are designed for everyday operations — inserting, updating, and deleting records. Think of an e-commerce website processing orders.
OLAP (Online Analytical Processing) systems are designed for reading and analyzing large amounts of historical data. They're used for reporting and business intelligence. Think of a dashboard showing last year's sales by region.
As a Data Analyst, you mostly deal with OLAP systems when building reports and dashboards.
Q12. What is a data warehouse, and how is it different from a database?
A database is optimized for transactional operations — fast inserts and updates for day-to-day business processes.
A data warehouse is optimized for analytics. It stores large volumes of historical data from multiple sources in a structured way, making it easy to run complex queries and reports. Tools like Amazon Redshift, Google BigQuery, and Snowflake are popular data warehouses.
The key difference: databases support live operations, warehouses support analysis.
Q13. Explain what a pivot table is and when you would use one.
A pivot table is a tool in Excel (and similar software) that lets you quickly summarize and analyze large datasets without writing formulas.
For example, if you have thousands of rows of sales data, a pivot table can instantly show you total sales by product category, region, or month — all with just a few clicks.
They're incredibly useful for quickly exploring data, finding patterns, and creating summary reports. If you're going into a Data Analyst interview without knowing pivot tables, that's a gap you need to fill — they come up constantly.
Q14. What is the difference between a primary key and a foreign key in a database?
A primary key is a column (or set of columns) that uniquely identifies each row in a table. No two rows can have the same primary key, and it can't be null. For example, a customer_id in a customers table.
A foreign key is a column in one table that refers to the primary key in another table. It creates a link between two tables. For example, an orders table might have a customer_id column that links back to the customers table.
Understanding keys is fundamental to writing JOIN queries in SQL.
Q15. What is data normalization?
Normalization is the process of organizing a database to reduce redundancy (repeated data) and improve data integrity.
For example, instead of storing the customer's full address in every order row, you store it once in a separate customers table and just reference the customer_id in the orders table.
There are different levels (called normal forms — 1NF, 2NF, 3NF) that define how "clean" the structure is. The goal is to make sure every piece of data is stored in only one place.
Q16. What is an outlier, and how do you deal with it?
An outlier is a data point that is significantly different from the rest of the data. For example, if most employees earn ₹40,000–₹80,000 per month and one row shows ₹5,00,000 — that's likely an outlier.
How you handle it depends on the context:
- Remove it if it's clearly a data entry error
- Keep it if it's a genuine extreme value that's important to your analysis (e.g., a very large one-time transaction)
- Investigate it to understand why it's there before making any decision
Never blindly delete outliers — always check what they represent.
Q17. What is the difference between mean, median, and mode?
- Mean — The average of all values. Add them all up and divide by the count. Sensitive to outliers.
- Median — The middle value when data is sorted. Not affected by outliers, so it's often more reliable for skewed data.
- Mode — The value that appears most frequently. Useful for categorical data.
For example, if you're looking at salaries in a company where the CEO earns ₹1 crore and everyone else earns ₹5–8 LPA, the mean salary will be misleading. The median gives a more honest picture.
Q18. What is data visualization, and which tools do you use for it?
Data visualization is the practice of presenting data in a graphical format — charts, graphs, maps, dashboards — so that patterns and insights are easier to understand at a glance.
A well-made chart can communicate in seconds what a spreadsheet of numbers would take minutes to explain.
Common tools include:
- Power BI — Very popular in corporate environments
- Tableau — Widely used and visually powerful
- Excel — Good for quick charts and basic dashboards
- Python (Matplotlib, Seaborn) — For custom visualizations in code
Q19. What is a correlation? Does correlation mean causation?
Correlation measures how strongly two variables are related. A correlation of +1 means as one goes up, the other goes up too. A correlation of -1 means as one goes up, the other goes down. Zero means no relationship.
But here's the important part — correlation does not mean causation. Just because two things move together doesn't mean one is causing the other.
A classic example: ice cream sales and drowning incidents are positively correlated — but ice cream doesn't cause drowning. Both increase in summer because of the heat. This is called a confounding variable.
Q20. What is the difference between a bar chart and a histogram?
Both display data using bars, but they're used for different things:
A bar chart is used to compare categories. For example, total sales by product type. The bars represent separate groups.
A histogram is used to show the distribution of a numerical variable. For example, how many students scored between 60–70, 70–80, 80–90, etc. The bars are continuous, with no gaps.
Knowing when to use which chart is a mark of a good analyst — and interviewers love to ask this.
Section 3: Advanced Data Analyst Interview Questions
These are typically asked for mid-level or senior analyst roles, but knowing them gives you a real edge even as a fresher.
Q21. What is A/B testing, and how is it used in data analysis?
A/B testing is a method of comparing two versions of something to see which one performs better. You split your audience into two groups — Group A sees version one, Group B sees version two — and then you measure which produces better results.
For example, an e-commerce website might A/B test two versions of a checkout button (red vs. green). After a week, if the green button has a 15% higher click rate with statistical significance, you keep the green button.
It's widely used in product, marketing, and UX teams, and Data Analysts are often responsible for setting up and interpreting A/B tests.
Q22. What is statistical significance, and why does it matter?
Statistical significance tells you whether a result from your data is likely real or just happened by chance.
When you run an A/B test or compare two groups, you get a p-value. If the p-value is below 0.05 (5%), the result is generally considered statistically significant — meaning there's less than a 5% chance the result occurred randomly.
This matters because without checking significance, you might make business decisions based on coincidental patterns in small datasets.
Q23. What is a data model, and why is it important?
A data model is a structured blueprint that defines how data is organized, stored, and related to other data. Think of it as the design plan for your database.
Good data models make it easy to query data efficiently, avoid duplication, and maintain consistency. Poor data models make reporting slow and messy.
Common types include relational models (tables with relationships), star schema (used in data warehouses), and snowflake schema (a more complex variation).
Q24. What is a star schema vs. a snowflake schema?
Both are used in data warehouses for organizing analytical data.
A star schema has one central fact table (containing metrics like sales amount) connected directly to dimension tables (like date, product, customer). It's simple and fast to query.
A snowflake schema is similar but the dimension tables are further normalized into sub-tables. It reduces redundancy but makes queries more complex.
For most analytical work, star schemas are preferred because they're easier and faster to query — especially in tools like Power BI.
Q25. What is the difference between supervised and unsupervised learning?
This is at the boundary of Data Analytics and Data Science but comes up often in advanced interviews.
Supervised learning trains a model on labeled data — data where you already know the answer. For example, training a model on past loan applications (where you know who defaulted) to predict future defaults.
Unsupervised learning finds patterns in data without labels. For example, grouping customers into segments based on their buying behavior without being told what the groups should be. This is called clustering.
Q26. How do you handle a dataset with a very large number of missing values?
There's no single right answer — it depends on how many values are missing and why.
- If a column has more than 50–60% missing values, it might be better to drop the column entirely.
- If only a few rows are missing a value, you can impute (fill in) using mean, median, or mode.
- If the missing values follow a pattern (e.g., missing for a specific product category), investigate why before deciding.
- You can also use machine learning-based imputation for complex cases.
Whatever you decide, document your approach — it needs to be justifiable to stakeholders.
Q27. What is data governance, and why does it matter?
Data governance is the set of rules, processes, and standards that define how data is collected, stored, managed, and used within an organization.
It covers things like: Who has access to what data? How long do we keep customer data? How do we ensure data quality? Who is responsible when data is incorrect?
Good data governance builds trust in the data. If analysts, managers, and executives don't trust the data they're working with, they won't use it to make decisions — which defeats the whole purpose of having a data team.
Q28. What is the difference between ETL and ELT?
ETL (Extract, Transform, Load) means data is extracted from sources, transformed (cleaned, formatted) in a staging area, and then loaded into the data warehouse.
ELT (Extract, Load, Transform) means data is loaded into the warehouse first, then transformed inside it. This approach is newer and works well with modern cloud data warehouses like BigQuery or Snowflake that can handle large-scale transformations.
Data Analysts don't usually build these pipelines, but understanding the concept shows technical maturity.
Q29. How would you present complex data findings to a non-technical stakeholder?
This is a soft skills question that shows up frequently in Data Analyst interviews, and it matters a lot.
The key is to focus on the "so what" — not the how. A marketing manager doesn't care about your SQL query or regression model. They care about: "What does this mean for our business?"
Tips for presenting to non-technical audiences:
- Lead with the key insight, not the methodology
- Use simple visuals instead of tables of numbers
- Avoid jargon — explain terms in plain language
- Frame findings around business outcomes (cost, revenue, risk, customer experience)
- Be ready to answer "what should we do about this?"
Q30. What is the concept of data-driven decision making?
Data-driven decision making means using data and analysis — rather than gut feeling or assumptions — as the primary basis for business decisions.
For example, instead of a marketing team deciding to run a promotion because it "seems like a good idea," they look at past campaign data, customer behavior, and conversion rates before committing budget.
As a Data Analyst, your job is to make it easier for teams to make these kinds of decisions by providing accurate, timely, and understandable data.
Section 4: Real-World Scenario-Based Questions
These questions test how you think and apply your skills in practical situations. Interviewers want to see your thought process, not just a textbook answer.
Q31. Your dashboard is showing a sudden 40% drop in sales last week. What do you do?
This is a classic scenario question. Here's how a good analyst would approach it:
Step 1 — Don't panic, investigate. First, check if it's a data issue. Is the data pipeline working? Are there any missing records or reporting delays?
Step 2 — Narrow it down. Is the drop across all products, regions, or customer types — or is it isolated to one area? This helps pinpoint the cause.
Step 3 — Look for external factors. Were there any technical outages, promotions ending, a competitor launch, or holiday periods that could explain the drop?
Step 4 — Cross-check other metrics. Did website traffic also drop? Did conversion rates fall? Are orders still coming in but not being counted?
Step 5 — Communicate clearly. Share your findings with the relevant team — even if the answer is "we're still investigating" — so no one is working on false assumptions.
Q32. You've been asked to build a report from scratch for a new business unit. Where do you start?
A good analyst doesn't just start pulling data — they start by asking the right questions:
- What decisions will this report support?
- Who is the audience — executives, managers, or the operations team?
- What metrics matter most to them?
- How often is this report needed — daily, weekly, monthly?
- Where does the data live, and how reliable is it?
Once you understand the "why," you can design the report to actually be useful rather than just technically correct.
Q33. You receive a dataset from a client that has conflicting data in two columns. How do you handle it?
First, don't make assumptions. Flag the conflict and investigate.
Questions to ask:
- Which source is considered the "source of truth" for this field?
- Is one column auto-generated by the system and one manually entered?
- Could this be a timing issue — where one field updated and the other didn't?
Once you understand the root cause, work with the data owner to define the correct rule. Document what you decided and why — because this kind of decision will need to be reproduced in the future.
Q34. How would you measure the success of a new feature launched on a mobile app?
You'd look at it from multiple angles:
- Adoption rate — What percentage of users tried the feature after launch?
- Engagement rate — Of those who tried it, how often do they use it?
- Retention impact — Are users who use the feature more likely to stay active?
- Error/crash rate — Is the feature performing reliably?
- User feedback — Are support tickets or reviews mentioning the feature positively or negatively?
Pair this with a baseline from before the feature launched, and ideally compare it against a control group through A/B testing.
Q35. A stakeholder says "I don't trust this data." How do you respond?
This is one of the most important soft-skill situations for a Data Analyst.
First, take the concern seriously — don't be defensive. Ask them to point out specifically what looks wrong to them.
Then investigate:
- Check the data source and pipeline for errors
- Cross-verify with another data source or manual records
- Look for known data quality issues
If the data is correct, walk them through your validation process step by step. Sometimes distrust comes from unfamiliarity, and a clear explanation builds confidence.
If there is a real issue, acknowledge it, fix it, and communicate what safeguards you're putting in place to prevent it in the future.
Section 5: Programming Questions — SQL, Python & Excel (with MCQs)
This section covers Data Analyst Interview Questions on SQL, Python, and Excel — including 10 MCQ-style questions with correct answers and explanations.
SQL Questions
Q36. What is the difference between WHERE and HAVING in SQL?
Both are used to filter records, but they work at different stages of a query.
WHERE filters rows before grouping happens. It works on individual rows.
HAVING filters groups after the GROUP BY clause has been applied. It works on aggregated results.
Example:
-- WHERE: Filter rows before grouping
SELECT department, COUNT(*) AS emp_count
FROM employees
WHERE salary > 30000
GROUP BY department;

-- HAVING: Filter after grouping
SELECT department, COUNT(*) AS emp_count
FROM employees
GROUP BY department
HAVING COUNT(*) > 10;
Q37. Write a SQL query to find the second highest salary from an employee table.
SELECT MAX(salary) AS second_highest_salary
FROM employees
WHERE salary < (SELECT MAX(salary) FROM employees);
This works by first finding the maximum salary, then finding the maximum salary among all salaries that are less than the top salary.
Q38. What are SQL JOINs? Explain the different types.
A JOIN is used to combine rows from two or more tables based on a related column.
- INNER JOIN — Returns only rows that have matching values in both tables
- LEFT JOIN — Returns all rows from the left table, and matching rows from the right (nulls where there's no match)
- RIGHT JOIN — Returns all rows from the right table, and matching rows from the left
- FULL OUTER JOIN — Returns all rows from both tables, with nulls where there's no match
-- Example: INNER JOIN
SELECT o.order_id, c.customer_name
FROM orders o
INNER JOIN customers c ON o.customer_id = c.customer_id;
MCQ 1 — SQL
Which SQL clause is used to sort the result of a query?
- A) GROUP BY
- B) ORDER BY
- C) SORT BY
- D) FILTER BY
✅ Correct Answer: B) ORDER BY
Explanation: The ORDER BY clause sorts query results in ascending (ASC) or descending (DESC) order. GROUP BY is used to group rows for aggregation, not for sorting. SORT BY and FILTER BY are not standard SQL clauses.
MCQ 2 — SQL
What does the COUNT(*) function do in SQL?
- A) Returns the sum of all values in a column
- B) Returns the number of rows in a result set
- C) Returns the maximum value in a column
- D) Returns only unique values in a column
✅ Correct Answer: B) Returns the number of rows in a result set
Explanation: COUNT(*) counts every row in a result, including rows with null values. If you want to count only non-null values in a specific column, use COUNT(column_name) instead.
MCQ 3 — SQL
Which of the following is used to remove duplicate rows from a query result?
- A) UNIQUE
- B) REMOVE DUPLICATES
- C) DISTINCT
- D) NOT NULL
✅ Correct Answer: C) DISTINCT
Explanation: The DISTINCT keyword in a SELECT statement filters out duplicate rows, returning only unique values. For example: SELECT DISTINCT city FROM customers;
MCQ 4 — SQL
What is the correct SQL syntax to update a record?
- A) MODIFY employees SET salary = 50000 WHERE id = 1
- B) UPDATE employees SET salary = 50000 WHERE id = 1
- C) CHANGE employees SET salary = 50000 WHERE id = 1
- D) ALTER employees salary = 50000 WHERE id = 1
✅ Correct Answer: B) UPDATE employees SET salary = 50000 WHERE id = 1
Explanation: The correct syntax for updating records in SQL is UPDATE table_name SET column = value WHERE condition. Always use a WHERE clause — without it, you'll update every row in the table!
Python Questions
Q39. What is the difference between a list and a tuple in Python?
Both are used to store multiple items, but there's one key difference: lists are mutable (changeable), tuples are immutable (unchangeable).
# List - you can modify it
my_list = [1, 2, 3]
my_list.append(4)  # Works fine

# Tuple - you cannot modify it
my_tuple = (1, 2, 3)
my_tuple.append(4)  # This will throw an error
For data analysis, tuples are useful when you want to make sure a set of values isn't accidentally changed.
Q40. How do you read a CSV file in Python using Pandas?
import pandas as pd

# Read a CSV file
df = pd.read_csv('sales_data.csv')

# View the first 5 rows
print(df.head())

# Check the shape (rows, columns)
print(df.shape)

# Check for null values
print(df.isnull().sum())
Pandas is the most popular library for data analysis in Python. The read_csv() function is one of the very first things you'll learn — and use constantly.
Q41. How do you filter rows in a Pandas DataFrame?
import pandas as pd

df = pd.read_csv('employees.csv')

# Filter rows where salary is greater than 50000
high_earners = df[df['salary'] > 50000]

# Filter with multiple conditions
senior_high = df[(df['salary'] > 50000) & (df['experience'] > 5)]

# Filter by a specific value
sales_team = df[df['department'] == 'Sales']

print(high_earners.head())
MCQ 5 — Python
Which Pandas function is used to check the number of rows and columns in a DataFrame?
- A) df.info()
- B) df.size()
- C) df.shape
- D) df.count()
✅ Correct Answer: C) df.shape
Explanation: df.shape returns a tuple like (rows, columns) — for example, (500, 12) means 500 rows and 12 columns. df.info() gives data types and null counts, df.size returns total elements, and df.count() returns non-null counts per column.
MCQ 6 — Python
Which of the following is used to handle missing values in a Pandas DataFrame?
- A) df.remove_nulls()
- B) df.fillna() or df.dropna()
- C) df.clean()
- D) df.fix_missing()
✅ Correct Answer: B) df.fillna() or df.dropna()
Explanation: df.dropna() removes rows or columns with missing values, while df.fillna(value) replaces missing values with a specified value (like 0, the mean, or "Unknown"). The other options don't exist in Pandas.
MCQ 7 — Python
What does the groupby() function in Pandas do?
- A) Sorts the DataFrame by a column
- B) Groups data by one or more columns and allows aggregation
- C) Merges two DataFrames together
- D) Removes duplicate rows
✅ Correct Answer: B) Groups data by one or more columns and allows aggregation
Explanation: groupby() works similarly to GROUP BY in SQL. It splits the data into groups and lets you apply functions like sum(), mean(), count(), etc. For example: df.groupby('department')['salary'].mean() gives the average salary per department.
Excel Questions
Q42. What is VLOOKUP in Excel and when would you use it?
VLOOKUP stands for Vertical Lookup. It searches for a value in the first column of a range and returns a value from another column in the same row.
Formula: =VLOOKUP(lookup_value, table_array, col_index_num, [range_lookup])
Example: You have a product ID in one sheet and want to fetch the product name from another sheet. VLOOKUP does exactly that.
When to use it: When you want to pull matching data from a separate table — similar to a JOIN in SQL.
Note: XLOOKUP is the modern replacement for VLOOKUP and is more flexible. Know both.
Q43. What is the difference between VLOOKUP and XLOOKUP?
| Feature | VLOOKUP | XLOOKUP |
|---|---|---|
| Search direction | Only left to right | Both directions |
| If not found | Returns an error | Can return a custom message |
| Multiple results | Returns first match only | Can return arrays |
| Ease of use | Slightly harder | Simpler syntax |
| Excel version | Available in all versions | Excel 2019+ and Microsoft 365 |
If you're working with a modern version of Excel or Microsoft 365, XLOOKUP is the better choice.
MCQ 8 — Excel
Which Excel function would you use to count cells that meet a specific condition?
- A) COUNT()
- B) COUNTA()
- C) COUNTIF()
- D) SUM()
✅ Correct Answer: C) COUNTIF()
Explanation: COUNTIF(range, criteria) counts cells that meet one condition — for example, =COUNTIF(A1:A100, "Mumbai") counts how many cells in that range contain "Mumbai". COUNT() counts numeric cells, COUNTA() counts non-empty cells, and SUM() adds values.
MCQ 9 — Excel
What does a Pivot Table in Excel allow you to do?
- A) Format cells with colors
- B) Summarize, group, and analyze large datasets without formulas
- C) Create macros to automate tasks
- D) Write SQL queries inside Excel
✅ Correct Answer: B) Summarize, group, and analyze large datasets without formulas
Explanation: Pivot Tables are one of the most powerful features in Excel for data analysis. They let you drag and drop fields to create instant summaries — like total sales by region, or average scores by student. No complex formulas needed.
MCQ 10 — Excel / General Analytics
What type of chart is best suited to show the trend of a value over time?
- A) Pie Chart
- B) Bar Chart
- C) Line Chart
- D) Scatter Plot
✅ Correct Answer: C) Line Chart
Explanation: Line charts are ideal for showing how a value changes over time — like monthly revenue, daily website visitors, or weekly temperatures. Pie charts show proportions, bar charts compare categories, and scatter plots show relationships between two variables.
Bonus Programming Questions
Q44. Write a SQL query to find all customers who placed more than 3 orders.
SELECT customer_id, COUNT(order_id) AS total_orders
FROM orders
GROUP BY customer_id
HAVING COUNT(order_id) > 3
ORDER BY total_orders DESC;
This uses GROUP BY to group orders by customer and HAVING to filter groups with more than 3 orders.
Q45. How do you merge two DataFrames in Python using Pandas?
import pandas as pd

# Create two sample DataFrames
customers = pd.DataFrame({
    'customer_id': [1, 2, 3],
    'name': ['Arjun', 'Priya', 'Ravi']
})

orders = pd.DataFrame({
    'order_id': [101, 102, 103],
    'customer_id': [1, 2, 1],
    'amount': [500, 800, 300]
})

# Merge them (like a SQL JOIN)
merged = pd.merge(customers, orders, on='customer_id', how='inner')
print(merged)
The how parameter works just like SQL JOINs — 'inner', 'left', 'right', or 'outer'.
Q46. What is conditional formatting in Excel, and when is it useful?
Conditional formatting automatically changes the appearance of a cell (color, font, icons) based on its value or a formula condition.
For example:
- Highlighting all sales figures below target in red
- Showing a green color gradient for high-performing regions
- Adding red arrows to cells where values dropped compared to last month
It's a great way to make dashboards and reports more intuitive without needing chart expertise.
Q47. How do you remove duplicates in Pandas?
import pandas as pd

df = pd.read_csv('data.csv')

# Check number of duplicates
print(df.duplicated().sum())

# Remove duplicate rows (keep first occurrence)
df_clean = df.drop_duplicates()

# Remove duplicates based on specific columns
df_clean = df.drop_duplicates(subset=['email', 'phone'])

print(df_clean.shape)
Always check whether duplicates are truly errors or if they represent legitimate repeat records (e.g., a customer placing multiple orders).
Q48. Write a SQL query to find the top 3 selling products by revenue.
SELECT
    product_name,
    SUM(quantity * price) AS total_revenue
FROM order_items
GROUP BY product_name
ORDER BY total_revenue DESC
LIMIT 3;
This aggregates revenue per product using SUM(), sorts in descending order, and returns only the top 3 using LIMIT.
Q49. What is the IF function in Excel, and how do you use it?
The IF function checks a condition and returns one value if it's true and another if it's false.
Syntax: =IF(condition, value_if_true, value_if_false)
Example: Mark students as Pass or Fail based on score:
=IF(B2 >= 40, "Pass", "Fail")
You can also nest multiple IF functions for more than two outcomes, though it's better to use IFS() for cleaner syntax in those cases.
Q50. How would you visualize the distribution of a numerical column in Python?
import pandas as pd
import matplotlib.pyplot as plt
import seaborn as sns

df = pd.read_csv('data.csv')

# Histogram using Matplotlib
plt.figure(figsize=(8, 5))
plt.hist(df['salary'], bins=20, color='steelblue', edgecolor='white')
plt.title('Distribution of Salary')
plt.xlabel('Salary')
plt.ylabel('Frequency')
plt.show()

# Or using Seaborn (looks nicer)
sns.histplot(df['salary'], bins=20, kde=True)
plt.title('Salary Distribution with KDE')
plt.show()
The kde=True option adds a smooth curve over the histogram to better show the distribution shape.
Conclusion
There you have it — 50 Data Analyst Interview Questions and Answers covering everything from the basics to advanced concepts, real-world scenarios, and programming skills in SQL, Python, and Excel.
If you've worked through this entire guide, you're already better prepared than most candidates walking into a data analyst interview. The key now is practice — run SQL queries on real datasets, build Excel dashboards from scratch, explore datasets in Python with Pandas, and try explaining your work in plain English.
Here's a quick recap of what to focus on most:
- Fundamentals first — Understand data types, analytics lifecycle, and common tools
- SQL is non-negotiable — Practice queries daily, especially JOINs, GROUP BY, and subqueries
- Excel is still widely used — Get comfortable with VLOOKUP/XLOOKUP, pivot tables, and IF functions
- Python skills stand out — Even basic Pandas knowledge puts you ahead in most fresher interviews
- Soft skills matter — Communication, stakeholder management, and the ability to tell a clear story with data are often what separate good analysts from great ones
Preparing for a Data Analyst role takes time, but every hour you put into practice compounds. Bookmark this guide, revisit it a few days before your interview, and go in confident.
Good luck — you've got this! 🚀
Tags: Data Analyst Interview Questions, Data Analyst for Freshers, SQL Interview Questions, Python for Data Analysis, Excel for Data Analytics, Power BI, Data Analytics 2025, Data Analyst Career, Fresher IT Jobs, Analytics Interview Prep
Slug: data-analyst-interview-questions-answers
Category: Interview Preparation | Data Analytics
Published by EduBrights — IT Training Institute, Chennai. Visit edubrights.in to explore our Data Analytics Programme.
Data Analyst Interview Questions
Data Analyst Interview Questions for Freshers
SQL Interview Questions for Data Analyst
Python for Data Analysis Interview